Journey of a DevOps Engineer

“The advantage of a bad memory is that one enjoys several times the same good things for the first time.”

Friedrich Nietzsche

This post first appeared on Redhat’s Enable Sysadmin community. You can find the post here.

Memory is a funny construct. What we remember is often not what happened, or even the order it happened in. One of the earliest memories I have about technology was a trip my father and I took. We drove to Manhattan, on a mission to buy a Christmas gift for my mother. This crazy new device, The Itty Bitty Book Light, had come out recently and, being an avid reader, my mother had to have one.

We drove to Manhattan, on a mission to buy a Christmas gift for my mother. This crazy new device, The Itty Bitty Book Light, had come out recently and, being an avid reader, my mother had to have one.

After navigating the streets of Manhattan and finding a parking spot, we walked down the block to what turned out to be a large bookstore. You’ve seen bookstores like this on TV and in the movies. It looks small from the outside, but once you walk in, the store is endless. Walls of books, sliding ladders, tables with books piled high. It was pretty incredible, especially for someone like me who loves reading.

But in this particular store, there was something curious going on. One of the tables was surrounded by adults, awed and whispering between one another. Unsure of what was going on, we approached. After pushing through the crowd, what I saw drew me in immediately. On the table, surrounded by books, was a small grey box, the Apple Macintosh. It was on, but no one dared approach it. No one, that is, except me. I was drawn like a magnet, immediately grokking that the small puck like device moved the pointer on the screen. Adults gasped and murmured, but I ignored them all and delved into the unknown. The year was, I believe, 1984.

Somewhere around the same time, though likely a couple years before, my father brought home a TI-99/4A computer. From what I remember, the TI had just been released, so this has to be somewhere around 1982. This machine served as the catalyst for my love of computer technology and was one of the first machines I ever cut code on.

My father tells a story about when I first started programming. He had been working on an inventory database, written from scratch, that he built for his job. I would spend hours looking over his shoulder, absorbing everything I saw. One time, he finished coding, saved the code, and started typing the command to run his code (“RUN”). Accordingly to him, I stopped him with a comment that his code was going to fail. Ignoring me as I was only 5 or 6 at the time (according to his recollection), he ran the code and, as predicted, it failed. He looked at me with awe and I merely looked back and replied “GOSUB but no RETURN”.

At this point I was off and running. Over the years I got my hands on a few other systems including the Timex Sinclair, Commodore 64 and 128, TRS-80, IBM PS/2, and finally, my very own custom built PC from Gateway 2000. Since them I’ve built hundreds of machines and spend most of my time on laptops now.

The Commodore 64 helped introduce me to the online world of Bulletin Board Systems. I spent many hours, much to the chagrin of my father and the phone bill, calling into various BBS systems in many different states. Initially I was just there to play the various door games that were available, but eventually discovered the troves of software available to download. Trading software become a big draw until I eventually stumbled upon the Usenet groups that some boards had available. I spent a lot of time reading, replying, and even ended up in more than one flame war.

My first introduction to Unix based operating systems was in college when I encountered an IBM AIX mainframe as well as a VAX. I also had access to a shell account at the local telephone company turned internet service provider. The ISP I was using helpfully sent out an email to all subscribers about the S.A.T.A.N. toolkit and how accounts found with the software in their home directories would be immediately banned. Being curious, I immediately responded looking for more information. And while my account was never banned, I did learn a lot.

At the same time, my father and I started our own BBS which grew into a local Internet Service Provider offering dial-up services. That company still exists today, though the dial-up service died off several years ago. This introduced me to networks and all the engineering that comes along with it.

From here my journey takes a bit of a turn. Since I was a kid, I’ve wanted to build video games. I’ve read a lot of books on the subject, talked to various developers (including my idol, John Carmack) and written a lot of code. I actually wrote a pacman clone, of sorts, on the Commodore 64 when I was younger. But, alas, I think I was born on the wrong coast. All of the game companies, at the time, were located on the west coast and I couldn’t find a way to get there. So, I redirected my efforts a bit and focused on the technology I could get my hands on.

Running a BBS, and later an ISP, was a great introduction into the world of networking. After working a few standard school-age jobs (fast food, restaurants, etc), I finally found a job doing tech support for an ISP. I paid attention, asked questions, and learned everything I could. I took initiative where I could, even writing a cli-based ticketing system with an mSQL database backing it.

This initiative paid of as I was moved later to the NOC and finally to Network Engineering. I lead the way, learning everything I could about ATM and helping to design and build the standard ATM-based node design used by the company for over a decade. I took over development of the in-house monitoring system, eventually rewriting it in KSH and, later, Perl. I also had a hand in development of a more modern ticketing system written in Perl that is still in use today.

I spent 20+ years as a network engineer, taking time along the way to ensure that we had Linux systems available for the various scripting and monitoring needed to ensure the network performed as it should. I’ve spent many hours writing code in shell, expect, perl, and other languages to automate updates and monitoring. Eventually, I found myself looking for a new role and a host of skills ranging from network and systems administration to coding and security.

About this time, DevOps was quickly becoming the next new thing. Initially I rejected the idea, solely responding to the “Development” and “Operations” tags that make up the name. Over time, however, I came to realize that DevOps is yet another fancy name for what I’ve been doing for decades, albeit with a few twists here and there. And so, I took a role as a DevOps Engineer.

DevOps is a fun discipline, mixing in technologies from across the spectrum in an effort to automate away everything you can. Let the machine do the work for you and spent your time on more interesting projects like building more automation. And with the advent of containers and orchestration, there’s more to do than ever.

These days I find myself leading a team of DevOps engineers, both guiding the path we take as we implement new technology and automate existing processes. I also spend a lot of time learning about new technologies both on my own and for my day job. My trajectory seems to be changing slightly as I head towards the world of the SRE. Sort of like DevOps, but a bit heavier on the development side of things.

Life throws curves and sometimes you’re not able to move in the direction you want. But if you keep at it, there’s something out there for everyone. I still love learning and playing with technology. And who knows, maybe I’ll end up writing games at some point. There’s plenty of time for another new hobby.
Ping, traceroute, and netstat are the trifecta network troubleshooting tools for a reason

This post first appeared on Redhat’s Enable Sysadmin community. You can find the post here.

I’ve spent a career building networks and servers, deploying, troubleshooting, and caring for applications. When there’s a network problem, be it outages or failed deployments, or you’re just plain curious about how things work, three simple tools come to mind: ping, traceroute, and netstat.

Ping

Ping is quite possibly one of the most well known tools available. Simply put, ping sends an “are you there?” message to a remote host. If the host is, in fact, there, it returns a “yup, I’m here” message. It does this using a protocol known as ICMP, or Internet Control Message Protocol. ICMP was designed to be an error reporting protocol and has a wide variety of uses that we won’t go into here.

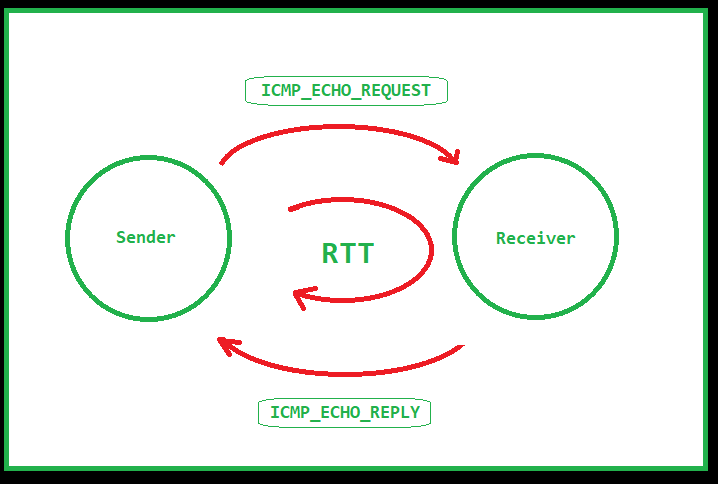
Ping uses two message types of ICMP, type 8 or Echo Request and type 0 or Echo Reply. When you issue a ping command, the source sends an ICMP Echo Request to the destination. If the destination is available, and allowed to respond, then it replies with an ICMP Echo Reply. Once the message returns to the source, the ping command displays a success message as well as the RTT or Round Trip Time. RTT can be an indicator of the latency between the source and destination.

Note: ICMP is typically a low priority protocol meaning that the RTT is not guaranteed to match what the RTT is to a higher priority protocol such as TCP.

Ping diagram (via GeeksforGeeks)

When the ping command completes, it displays a summary of the ping session. This summary tells you how many packets were sent and received, how much packet loss there was, and statistics on the RTT of the traffic. Ping is an excellent first step to identifying whether or not a destination is “alive” or not. Keep in mind, however, that some networks block ICMP traffic, so a failure to respond is not a guarantee that the destination is offline.

 $ ping google.com
PING google.com (172.217.10.46): 56 data bytes
64 bytes from 172.217.10.46: icmp_seq=0 ttl=56 time=15.740 ms
64 bytes from 172.217.10.46: icmp_seq=1 ttl=56 time=14.648 ms
64 bytes from 172.217.10.46: icmp_seq=2 ttl=56 time=11.153 ms
64 bytes from 172.217.10.46: icmp_seq=3 ttl=56 time=12.577 ms
64 bytes from 172.217.10.46: icmp_seq=4 ttl=56 time=22.400 ms
64 bytes from 172.217.10.46: icmp_seq=5 ttl=56 time=12.620 ms
^C
--- google.com ping statistics ---
6 packets transmitted, 6 packets received, 0.0% packet loss
round-trip min/avg/max/stddev = 11.153/14.856/22.400/3.689 ms

The example above shows a ping session to google.com. From the output you can see the IP address being contacted, the sequence number of each packet sent, and the round trip time. 6 packets were sent with an average RTT of 14ms.

One thing to note about the output above and the ping utility in general. Ping is strictly an IPv4 tool. If you’re testing in an IPv6 network you’ll need to use the ping6 utility. The ping6 utility works roughly identical to the ping utility with the exception that it uses IPv6.

Traceroute

Traceroute is a finicky beast. The premise is that you can use this tool to identify the path between a source and destination point. That’s mostly true, with a couple of caveats. Let’s start by explaining how traceroute works.

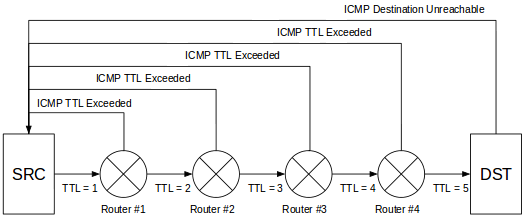
Traceroute diagram (via StackPath)

Think of traceroute as a string of ping commands. At each step along the path, traceroute identifies the IP of the hop as well as the latency to that hop. But how is it finding each hop? Turns out, it’s using a bit of trickery.

Traceroute uses UDP or ICMP, depending on the OS. On a typical *nix system it uses UDP by default, sending traffic to port 33434 by default. On a Windows system it uses ICMP. As with ping, traceroute can be blocked by not responding to the protocol/port being used.

When you invoke traceroute you identify the destination you’re trying to reach. The command begins by sending a packet to the destination, but it sets the TTL of the packet to 1. This is significant because the TTL value determines how many hops a packet is allowed to pass through before an ICMP Time Exceeded message is returned to the source. The trick here is to start the TTL at 1 and increment it by 1 after the ICMP message is received.

$ traceroute google.com
traceroute to google.com (172.217.10.46), 64 hops max, 52 byte packets
 1  192.168.1.1 (192.168.1.1)  1747.782 ms  1.812 ms  4.232 ms
 2  10.170.2.1 (10.170.2.1)  10.838 ms  12.883 ms  8.510 ms
 3  xx.xx.xx.xx (xx.xx.xx.xx)  10.588 ms  10.141 ms  10.652 ms
 4  xx.xx.xx.xx (xx.xx.xx.xx)  14.965 ms  16.702 ms  18.275 ms
 5  xx.xx.xx.xx (xx.xx.xx.xx)  15.092 ms  16.910 ms  17.127 ms
 6  108.170.248.97 (108.170.248.97)  13.711 ms  14.363 ms  11.698 ms
 7  216.239.62.171 (216.239.62.171)  12.802 ms
    216.239.62.169 (216.239.62.169)  12.647 ms  12.963 ms
 8  lga34s13-in-f14.1e100.net (172.217.10.46)  11.901 ms  13.666 ms  11.813 ms

Traceroute displays the source address of the ICMP message as the name of the hop and moves on to the next hop. When the source address matches the destination address, traceroute has reached the destination and the output represents the route from the source to the destination with the RTT to each hop. As with ping, the RTT values shown are not necessarily representative of the real RTT to a service such as HTTP or SSH. Traceroute, like ping, is considered to be lower priority so RTT values aren’t guaranteed.

There is a second caveat with traceroute you should be aware of. Traceroute shows you the path from the source to the destination. This does not mean that the reverse is true. In fact, there is no current way to identify the path from the destination to the source without running a second traceroute from the destination. Keep this in mind when troubleshooting path issues.

Netstat

Netstat is an indispensable tool that shows you all of the network connections on an endpoint. That is, by invoking netstat on your local machine, all of the open ports and connections are shown. This includes connections that are not completely established as well as connections that are being torn down.

$ sudo netstat -anptu
Active Internet connections (servers and established)
Proto Recv-Q Send-Q Local Address           Foreign Address         State       PID/Program name
tcp        0      0 0.0.0.0:25              0.0.0.0:*               LISTEN      4417/master
tcp        0      0 0.0.0.0:443             0.0.0.0:*               LISTEN      2625/java
tcp        0      0 192.168.1.38:389        0.0.0.0:*               LISTEN      559/slapd
tcp        0      0 0.0.0.0:22              0.0.0.0:*               LISTEN      1180/sshd
tcp        0      0 192.168.1.38:37190      192.168.1.38:389        ESTABLISHED 2625/java
tcp        0      0 192.168.1.38:389        192.168.1.38:45490      ESTABLISHED 559/slapd

The output above shows several different ports in a listening state as well as a few established connections. For listening ports, if the source address is 0.0.0.0, it is listening on all available interfaces. If there is an IP address instead, then the port is open only on that specific interface.

The established connections show the source and destination IPs as well as the source and destination ports. The Recv-Q and Send-Q fields show the number of bytes pending acknowledgement in either direction. Finally, the PID/Program name field shows the process ID and the name of the process responsible for the listening port or connection.

Netstat also has a number of switches that can be used to view other information such as the routing table or interface statistics. Both IPv4 and IPv6 are supported. There are switches to limit to either version, but both are displayed by default.

In recent years, netstat has been superseded by the ss command. You can find more information on the ss command in this post by Ken Hess.

Conclusion

As you can see, these tools are invaluable when troubleshooting network issues. As a network or systems administrator, I highly recommend becoming intimately familiar with these tools. Having these available may save you a lot of time troubleshooting.

Proxy by Traefik

For the past 30 or so years, if you wanted to proxy traffic to your web server, there were two, sometimes three, primary applications you reached for. Apache httpd, nginx, and HAProxy.

Apache httpd is one of the first web servers created, and is currently one of the most popular in use. While primarily used to serve web traffic, httpd can also be used to proxy traffic with the mod_proxy module. In addition to acting as a simple proxy, mod_proxy can also cache traffic, allowing for significant latency reduction for clients.

HAProxy is another option for proxying traffic. HAProxy tends to be deployed in load balancing scenarios and not single-server proxy situations. It is used by a number of high profile websites due to its speed and efficiency.

Finally, nginx is the third proxying solution. In addition to proxying, nginx can also serve many of the same roles as Apache httpd including local balancing, caching, and traditional web serving. Like haproxy, nginx is known for more efficient memory usage as compared to Apache httpd.

These solutions are battle hardened and have worked well for many years. But as technology changes, it often requires changes in the tools we use. With the advent of containerization, the tools we use should be re-examined and we should determine if we still have the best tools for the job.

Both nginx and haproxy were the primary choices used for proxying with containers. As the technology matured, however, new tools were created to take advantage of new features. One of those tools is Traefik.

Traefik is, according to their marketing, a “cloud native edge router.” If we tear apart the marketing speak, it’s basically a proxy built with containers in mind. It’s written in Go, and it has quite a few tricks up its sleeve.

You can use Traefik in the same general context as any of the other proxies, deploying it on a normal server and using a static configuration. Even deployed like this, the configuration is quite straightforward and very flexible.

But the real power of Traefik comes when it’s deployed in a container environment. Instead of using a static configuration, Traefik can listen to the docker daemon for specific labels applied to containers. Those labels contain the Traefik configuration for the container they’re applied to. It works similar to the static configuration, but it’s dynamic in nature, configuring Traefik as containers are started and stopped.

The community version of Traefik allows this by directly mounting the docker socket file, which is a bit of a security risk. If this container were to be compromised, an attacker could use the mounted socket to control other containers on the server. So this isn’t a secure way of deploying Traefik.

There are other ways to deploy, however, that make the system inherently more secure. Traefik has released an enterprise version, TraefikEE, that decouples the configuration management piece into its own container. This container also mounts the docker socket file, but has no external ports open, thereby isolating the container. The purpose of this new management container is to read changes in the labels and push the configuration to the primary Traefik container. It also scales, allowing additional Traefik nodes to be added which will receive the configuration from the management container.

Another way to deploy this securely is to use an external storage container for the traefik configuration. Consul is a popular option for this. Consul, amongst other things, is a key-value store. The configuration for Traefik can be stored here and dynamically updated as needed. Traefik will automatically re-read the configuration and adjust accordingly.

There are caveats with this method, however. First, you’ll need a way to get the configuration for the containers into Consul. Fortunately, there’s an open source project that may be able to do this already called registrator.

The registrator project works similar to how the management container works for TraefikEE, though in a more general way. It’s not specifically for Traefik, but intended to register containers with Consul. It’s an isolated container that listens for labels and adds the data to Consul. There are no open ports, reducing the likelihood that this particular container can be compromised and used to attack the rest of the system.

I haven’t tested using registrator in this way, however. (It doesn’t work, see the UPDATE below) I believe it would require modifying the registrator configuration to both register the containers as well as add arbitrary configuration information to Consul. This is something I’ll be investigating later as I learn more about how Consul works.

Another caveat to this approach is that there is no atomic update mechanism in Consul. What this means is that if Consul reads the configuration while it’s being updated by something like registrator, it’s will end up using an incomplete configuration until the next time it reads the configuration. There is a workaround for this in the documentation, but it requires additional programming to put into place.

Despite these few drawbacks, however, Traefik is an amazing tool for proxying in a container environment. And the Containous team is hard at work on version 2 which significantly cleans up and enhances the configuration possible with Traefik as well as adding the ability to add middleware functions that can be used to dynamically alter traffic as it passes through Traefik. Definitely worth checking out when it’s released.

UPDATE: I finally had a chance to do some research on registering services with Consul and inserting data in the to he KV store. Unfortunately, registrator can’t do this job. It only handles creating tags on a Consul entry and not KV entries.

I have been unsuccessful, thus far, in finding a solution for this particular use case. However, I believe that the registrator source code can be updated to allow for this.

Keepin’ TCP Alive

I was debugging an odd network issue lately that turned out to have a pretty simple explanation. A client on the network was intermittently experiencing significant delays in accessing the network. Upon closer inspection, it turned out that prior to the delay, the client was being left idle for long periods of time. With this additional information it was pretty easy to identify that there was likely a connection between the client and server that was being torn down for being idle.

So in the end, the cause of the problem itself was pretty simple to identify. The fix, however, is more of a conundrum. The obvious answer is to adjust the timers and prevent the connection from being torn down. But what timers should be adjusted? There are the keepalive timers on the client, the keepalive timers on the server, and the idle teardown timers on the firewall in the middle.

TCP keepalive handling varies between operating systems. If we look at the three major operating systems, Linux, Windows, and OS X, then we can make the blanket statement that, by default, keepalives are sent after two hours of idle time. But, most firewalls seem to have a default TCP teardown timer of one hour. These defaults are not conducive to keeping idle connections alive.

The optimal scenario for timeouts is for the clients to have a keepalive timer that fires at an interval lower than that of the idle tcp timeout on the firewall. The actual values to use, as well as which devices should be changed, is up for debate. The firewall is clearly the easier point at which to make such a change. Typically there are very few firewall devices that would need to be updated as compared to the larger number of client devices. Additionally, there will likely be fewer firewalls added to the network over time, so ensuring that timers are properly set is much easier. On the other hand, the defaults that firewalls are generally configured with have been chosen specifically by the vendor for legitimate reasons. So perhaps the clients should conform to the setting on the firewall? What is the optimal solution?

And why would we want to allow idle connections anyway? After all, if a connection is idle, it’s not being used. Clearly, any application that needed a connection to remain open would send some sort of keepalive, right? Is there a valid reason to allow these sorts of connections for an extended period of time?

As it turns out, there are valid reasons for connections to remain active, but idle. For instance, database connections are often kept for longer periods of time for performance purposes. The TCP handshake can take a considerable amount of time to perform as opposed to the simple matter of retrieving data from a database. So if the database connection remains established, additional data can be retrieved without the overhead of TCP setup. But in these instances, shouldn’t the application ensure that keepalives are sent so that the connection is not prematurely terminated by an idle timer somewhere along the data path? Well, yes. Sort of. Allow me to explain.

When I first discovered the source of the network problem we were seeing, I chalked it up to lazy programming. While it shouldn’t take much to add a simple keepalive system to a networked application, it is extra work. As it turns out, however, the answer isn’t quite that simple. All three major operating systems, Windows, Linux, and OS X, all have kernel level mechanisms for TCP keepalives. Each OS has a slightly different take on how keepalive timers should work.

Linux has three parameters related to tcp keepalives :

tcp_keepalive_time
The interval between the last data packet sent (simple ACKs are not considered data) and the first keepalive probe; after the connection is marked to need keepalive, this counter is not used any further
tcp_keepalive_intvl
The interval between subsequential keepalive probes, regardless of what the connection has exchanged in the meantime
tcp_keepalive_probes
The number of unacknowledged probes to send before considering the connection dead and notifying the application layer

OS X works quite similar to Linux, which makes sense since they’re both *nix variants. OS X has four parameters that can be set.

keepidle
Amount of time, in milliseconds, that the connection must be idle before keepalive probes (if enabled) are sent. The default is 7200000 msec (2 hours).
keepintvl
The interval, in milliseconds, between keepalive probes sent to remote machines, when no response is received on a keepidle probe. The default is 75000 msec.
keepcnt
Number of probes sent, with no response, before a connection is dropped. The default is 8 packets.
always_keepalive
Assume that SO_KEEPALIVE is set on all TCP connections, the kernel will periodically send a packet to the remote host to verify the connection is still up.

Windows acts very differently from Linux and OS X. Again, there are three parameters, but they perform entirely different tasks. All three parameters are registry entries.

KeepAliveInterval
This parameter determines the interval between TCP keep-alive retransmissions until a response is received. Once a response is received, the delay until the next keep-alive transmission is again controlled by the value of KeepAliveTime. The connection is aborted after the number of retransmissions specified by TcpMaxDataRetransmissions have gone unanswered.
KeepAliveTime
The parameter controls how often TCP attempts to verify that an idle connection is still intact by sending a keep-alive packet. If the remote system is still reachable and functioning, it acknowledges the keep-alive transmission. Keep-alive packets are not sent by default. This feature may be enabled on a connection by an application.
TcpMaxDataRetransmissions
This parameter controls the number of times that TCP retransmits an individual data segment (not connection request segments) before aborting the connection. The retransmission time-out is doubled with each successive retransmission on a connection. It is reset when responses resume. The Retransmission Timeout (RTO) value is dynamically adjusted, using the historical measured round-trip time (Smoothed Round Trip Time) on each connection. The starting RTO on a new connection is controlled by the TcpInitialRtt registry value.

There’s a pretty good reference page with information on how to set these parameters that can be found here.

We still haven’t answered the question of optimal settings. Unfortunately, there doesn’t seem to be a correct answer. The defaults provided by most firewall vendors seem to have been chosen to ensure that the firewall does not run out of resources. Each connection through the firewall must be tracked. As a result, each connection uses up a portion of memory and CPU. Since both memory and CPU are finite resources, administrators must be careful not to exceed the limits of the firewall platform.

There is some good news. Firewalls have had a one hour tcp timeout timer for quite a while. As time has passed and new revisions of firewall hardware are released, the CPU has become more powerful and the amount of memory in each system has grown. The default one hour timer, however, has remained in place. This means that modern firewall platforms are much better prepared to handle an increase in the number of connections tracked. Ultimately, the firewall platform must be monitored and appropriate action taken if resource usage becomes excessive.

My recommendation would be to start by setting the firewall tcp teardown timer to a value slightly higher than that of the clients. For most networks, this would be slightly over two hours. The firewall administrator should monitor the number of connections tracked on the firewall as well as the resources used by the firewall. Adjustments should be made as necessary.

If longer lasting idle connections are unacceptable, then a slightly different tactic can be used. The firewall teardown timer can be set to a level comfortable to the administrator of the network. Problematic clients can be updated to send keepalive packets at a shorter interval. These changes will likely only be necessary on servers. Desktop systems don’t have the same need as servers for long-term establishment of idle connections.

Towards Building More Secure Networks

It is no surprise that security is at the forefront of everyone’s minds these days. With high profile breaches, to script kiddies wreaking havoc across the Internet, it is obvious that there are some weaknesses that need to be addressed.

In most cases, complete network redesigns are out of the question. This can be extremely invasive and costly. However, it may be possible to augment the existing network in such a manner as to add additional layers of security. It’s also possible that this may lead to the possibility of being able to make even more changes down the road.

So what do I mean by this? Allow me to explain…

Many networks are fairly simple with only a few subnets, typically a user and a server subnet. Sometimes there’s a bit of complexity on the user side, creating subnets per department, or subnets per building. Often this has more to do with manageability of users rather than security. Regardless, it’s a good practice that can be used to make a network more secure in the long run.

What is often neglected is the server side of things. Typically, there are one, maybe two subnets. Outside users are granted access to the standard web ports. Sometimes more ports such as ssh and ftp are opened for a variety of reasons. What administrators don’t realize, or don’t intend is that they’re allowing outsiders direct access to their core servers, without any sort of security in front of it. Sure, sure, there might be a firewall, but a firewall is there to ensure you only come in on the proper ports, right? If your traffic is destined for port 80, it doesn’t matter if it’s malicious or not, the firewall lets it through anyway.

But what’s the alternative? What can be done instead? Well, what about sending outside traffic to a separate network where the systems being accessed are less critical, and designed to verify traffic before passing it on to your core servers? What I’m talking about is creating a DMZ network and forcing all users through a proxy. Even a simple proxy can help to prevent many attacks by merely dropping illegal traffic and not letting it through to the core server. Proxies can also be heavily fortified with HIDS and other security software designed to look for suspicious traffic and block it.

By adding in this DMZ layer, you’ve put a barrier between your server core and the outside world. This is known as layered defense. You can add additional layers as time and resources allow. For instance, I recommend segmenting away database servers as well as identity management servers. Adding this additional segmentation can be done over time as new servers come online and old servers are retired. The end goal is to add this additional security without disrupting the network as a whole.

If you have the luxury of building a new network from the ground up, however, make sure you build this in from the start. There is, of course, a breaking point. It makes sense to create networks to segregate servers by security level, but it doesn’t make sense to segregate purely to segregate. For instance, you may segregate database and identity management servers away from the rest of the servers, but segregating Oracle servers away from MySQL servers may not add much additional security. There are exceptions, but I suggest you think long and hard before you make such an exception. Are you sure that the additional management overhead is worth the security? There’s always a cost/benefit analysis to perform.

Segregating networks is just the beginning. The purpose here is to enhance security. By segregating networks, you can significantly reduce the number of clients that need to access a particular server. The whole world may need to access your proxy servers, but only your proxy servers need to access the actual web application servers. Likewise, only your web application servers need access to your database servers. Using this information, you can tighten down your firewall. But remember, a firewall is just a wall with holes in it. The purpose is to deflect random attacks, but it does little to nothing to prevent attacks on ports you’ve opened. For that, there are other tools.

At the very edge, simplistic fire walling and generally loose HIDS can be used to deflect most attacks. As you move further within the network, additional security can be used. For instance, deploying an IPS at the very edge of the network can result in the IPS being quickly overwhelmed. Of course, you can buy a bigger, better IPS, but to what end? Instead, you can move the IPS further into the network, placing it where it be more effective. If you place it between the proxy and the web server, you’ve already ensured that the only traffic hitting the IPS is loosely validated HTTP traffic. With this knowledge, you can reduce the number of signatures the IPS needs to have, concentrating on high quality HTTP signatures. Likewise, an IPS between the web servers and database servers can be configured with high quality database signatures. You can, in general, direct the IPS to block any and all traffic that falls outside of those parameters.

As the adage goes, there is no silver bullet for security. Instead, you need to use every weapon in your arsenal and put together a solid defense. By combining all of these techniques together, you can defend against many attacks. But remember, there’s always a way in. You will not be able to stop the most determined attacker, you can only hope to slow him down enough to limit his access. And remember, securing your network is only one aspect of security. Don’t forget about the other low hanging fruit such as SQL injection, cross site scripting, and other common application holes. You may have the most secure network in existence, but a simple SQL injection attack can result in a massive data breach.

Helpful Rules for OSSEC

OSSEC has quickly become a primary weapon in my security toolkit.  It’s flexible, fast, and very easy to use.  I’d like to share a few rules I’ve found useful as of late.

I primarily use OSSEC in a server/client setup.  One side effect of this is that when I make changes to the agent’s configuration, it takes some time for it to push out to all of the clients.  Additionally, clients don’t restart automatically when a new agent config is received.  However, it’s fairly easy to remedy this.

First, make sure you have syscheck enabled and that you’re monitoring the OSSEC directory for changes.  I recommend monitoring all of /var/ossec and ignoring a few specific directories where files change regularly. You’ll need to add this to both the ossec.conf as well as the agent.conf.

<directories check_all="yes">/var</directories>
<ignore type="sregex">^/var/ossec/queue/</ignore>
<ignore type="sregex">^/var/ossec/logs/</ignore>
<ignore type="sregex">^/var/ossec/stats/</ignore>

The first time you set this up, you’ll have to manually restart the clients after the new config is pushed to them. All new clients should work fine, however.

Next, add the following rules to your local_rules.xml file (or whatever scheme you’re using).

<rule level="12" id="100005">
   <if_matched_group>syscheck</if_matched_group>
   <description>agent.conf changed, restarting OSSEC</description>
   <match>/var/ossec/etc/shared/agent.conf</match>
</rule>

This rule looks for changes to the agent.conf file and triggers a level 12 alert. Now we just need to capture that alert and act on it. To do that, you need to add the following to your ossec.conf file on the server.

<command>
    <name>restart-ossec</name>
    <executable>restart-ossec.sh</executable>
    <expect>srcip</expect>
    <timeout_allowed>no</timeout_allowed>
</command>
<active-response>
    <command>restart-ossec</command>
    <location>local</location>
    <rules_id>100005</rules_id>
</active-response>

You need to add this to the top of your active response section, above any other rules. OSSEC matches the first active-response block and ignores any subsequent ones. The restart-ossec.sh script referenced in the command section should exist already in your active-response/bin directory as it’s part of the distribution.

And that’s all there is to it. Whenever the agent.conf file changes on a client, it’ll restart the OSSEC agent, reading in the new configuration.

Next up, a simple DoS prevention rule for apache web traffic. I’ve had a few instances where a single IP would hammer away at a site I’m responsible for, eating up resources in the process. Generally speaking, there’s no real reason for this. So, one solution is to temporarily block IPs that are abusive.

Daniel Cid, the author of OSSEC, helped me out a little on this one. It turned out to be a little less intuitive than I expected.

First, you need to group together all of the “normal” error response codes. The actual error responses (400/500 errors) are handled with other, more aggressive rules, so you can ignore most of them. For our purposes, we want to trigger on 200/300/400 error codes.

<rule id="131105" level="1">
      <if_sid>31101, 31108, 31100</if_sid>
      <description>Group of all "normal" 200/300/400 error codes.</description>
</rule>

Next, we want to create a composite rule that will fire after a set frequency and time limit. In short, we want this rule to fire if X matches are made in Y seconds.

<rule id="131106" level="10" frequency="500" timeframe="60">
      <if_matched_sid>131105</if_matched_sid>
      <same_source_ip />
      <description>Excessive access, Temporary block</description>
</rule>

That should be all you need provided you have active response already enabled. You can also add a specific active response for this rule that blocks for a shorter, or longer, period of time. That’s the beauty of OSSEC, the choice is in your hands.

I hope you find these rules helpful. If you have any questions or comments, feel free to post them below.

if (blocked($content))

And the fight rages on… Net Neutrality, to block or not to block.

Senator Byron Dorgan, a Democrat from North Dakota, is introducing new legislation to prevent service providers from blocking Internet content. Dorgan is not new to the arena, having put forth legislation in previous years dealing with the same thing. This time, however, he may be able to push it through.

So what’s different this time? Well, for one, we have a new president. And this new president has already stated that Net Neutrality is high on his list of technology related actions. So, at the very least, it appears that Dorgan has the president in his corner.

Of course, some service providers are not happy about this. Comcast has gone on record with the following:

“We don’t believe legislation is necessary in this area and could harm innovation and investments,” said Sena Fitzmaurice, Comcast’s senior director of government affairs and corporate communications, in a phone interview. “We have consistently said that all our customers have access to content available on the Internet.”

And she’s right! Well.. sort of. Comcast custmers do have access to content. Or, rather, they do now. I do recall a recent period of time where Comcast was “secretly” resetting bittorrent connections, and they have talked about both shaping and capping customers. So, in the end, you may get all of the content, just not all at the same level of service.

But I think, overall, Dorgan has an uphill battle. Net Neutrality is a concept not unlike free speech. It’s a great concept, but sometimes its implementation is questionable. For instance, If we look at pure Net Neutrality, then providers are required to allow all content without any shaping or blocking. Even bandwidth caps can be seen to fall under the umbrella of Net Neutrality. As a result, customers can theoretically use 100% of their alloted bandwidth at all times. This sounds great, until you realize that bandwidth, in some instances, and for perfectly legitimate reasons, is limited.

Take rural areas, for instance, especially in the midwest where homes can be miles away from each other. It can be cost-prohibitive for a service provider to run lines out to remote areas. And if they do, it’s generally done using line extender technology that can allow for decent voice signals over copper, but not high-speed bandwidth. One or two customer connections don’t justify the cost of the equipment. So, those customers are relegated to slower service, and may end up devices with high customer to bandwidth ratios. In those cases, a single customer can cause severe degradation of service for all the others, merely by using a lot of bandwidth.

On the flip side, however, allowing service providers to block and throttle according to their own whims can result in anti-competitive behavior. Take, for instance, IP Telephony. There are a number of IP Telephony providers out there that provide the technology to place calls over a local Internet connection. Skype and Vonage are two examples. Neither of these providers has any control over the local network, and thus their service is dependent on the local service provider. But let’s say the local provider wants to offer VoIP service. What’s to prevent that local provider from throttling or outright blocking Skype and Vonage? And thus we have a problem. Of course, you can fall back to the “let the market decide” argument. The problem with this is that, often, there is only one or two local providers, usually one Telco and one Cable. The Telco provider may throttle and block voice traffic, while the Cable provider does the same for video. Thus, the only choice is to determine which we would rather have blocked. Besides, changing local providers can be difficult as email addresses, phone numbers, etc. are usually tied to the existing provider. And on top of that, most people are just too lazy to change, they would rather complain.

My personal belief is that the content must be available and not throttled. However, I do believe the local provider should have some control over the network. So, for instance, if one type of traffic is eating up the majority of the bandwidth on the network, the provider should be able to throttle that traffic to some degree. However, they must make such throttling public, and they must throttle ALL of that type of traffic. Going back to the IP Telephony example, if they want to throttle Skype and Vonage, they need to throttle their own local VoIP too.

It’s a slippery slope and I’m not sure there is a perfect answer. Perhaps this new legislation will be a step in the right direction. Only time will tell.

Bandwidth in the 21st Century

As the Internet has evolved, the one constant has been the typical Internet user.  Typical users used the Internet to browse websites, a relatively low-bandwidth activity.  Even as the capabilities of the average website evolved, bandwidth usage remained relatively low, increasing at a slow rate.

In my own experience, a typical Internet user, accessing the Internet via DSL or cable, only uses a very small portion of the available bandwidth.  Bandwidth is only consumed for the few moments it takes to load a web page, and then usage falls to zero.  The only real difference was the online gamer.  Online gamers use a consistent amount of bandwidth for long periods of time, but the total bandwidth used at any given moment is still relatively low, much lower than the available bandwidth.

Times are changing, however.  In the past few years, peer-to-peer applications such as Napster, BitTorrent, Kazaa, and others have become more mainstream, seeing widespread usage across the Internet.  Peer-to-peer applications are used to distribute files, both legal and illegal, amongst users across the Internet.  Files range in size from small music files to large video files.  Modern applications such as video games and even operating systems have incorporated peer-to-peer technology to facilitate rapid deployment of software patches and updates.

Voice and video applications are also becoming more mainstream.  Software applications such as Joost, Veoh, and Youtube allow video streaming over the Internet to the user’s PC.  Skype allows the user to make phone calls via their computer for little or no cost.  Each of these applications uses bandwidth at a constant rate, vastly different from that of web browsing.

Hardware devices such as the XBox 360, AppleTV, and others are helping to bring streaming Internet video to regular televisions within the home.  The average user is starting to take advantage of these capabilities, consuming larger amounts of bandwidth, for extended periods of time.

The end result of all of this is increased bandwidth within the provider network.  Unfortunately, most providers have based their current network architectures on outdated over-subscription models, expecting users to continue their web-browsing patterns.  As a result, many providers are scrambling to keep up with the increased bandwidth demand.  At the same time, they continue releasing new access packages claiming faster and faster speeds.

Some providers are using questionable practices to ensure the health of their network.  For instance, Comcast is allegedly using packet sniffing techniques to identify BitTorrent traffic.  Once identified, they send a reset command to the local BitTorrent client, effectively severing the connection and canceling any file transfers.  This has caught the attention of the FCC who has released a statement that they will step in if necessary.

Other providers, such as Time Warner, are looking into tiered pricing for Internet access.  Such plans would allow the provider to charge extra for users that exceed a pre-set limit.  In other words, Internet access becomes more than the typical 3/6/9 Mbps access advertised today.  Instead, the high speed access is offset by a total transfer limit.  Hopefully these limits will be both reasonable and clearly defined.  Ultimately, though, it becomes the responsibility of the user to avoid exceeding the limit, similar to that of exceeding the minutes on a cell phone.

Pre-set limits have problems as well, though.  For instance, Windows will check for updates at a regular interval, using Internet bandwidth to do so.  Granted, this is generally a small amount, but it adds up over time.  Another example is PPPoE and DHCP traffic.  Most DSL customers are configured using PPPoE for authentication.  PPPoE sends keep-alive packets to the BRAS to ensure that the connection stays up.  Depending on how the ISP calculates bandwidth usage, these packets will likely be included in the calculation, resulting in “lost” bandwidth.  Likewise, DHCP traffic, used mostly by cable subscribers, will send periodic requests to the DHCP server.  Again, this traffic will likely be included in any bandwidth calculations.

In the end, it seems that substantial changes to the ISP structure are coming, but it is unclear what those changes may be.  Tiered bandwidth usage may be making a comeback, though I suspect that consumers will fight against it.  Advances in transport technology make increasing bandwidth a simple matter of replacing aging hardware.  Of course, replacements cost money.  So, in the end, the cost may fall back on the consumer, whether they like it or not.

Troubleshooting 101

There seems to be a severe lack of understanding and technique when it comes to troubleshooting these days. It seems to me that a large amount of troubleshooting effort is completely wasted on wild ideas and theories while the simplest and most direct solutions are ignored.

Occam’s Razor states: “entities should not be multiplied beyond necessity.” Simply put, the easiest solution is often the best. This is the perfect mindset for anyone who does troubleshooting. There is no need to delve right into the most obscure reasons for a failure, start with the simple stuff.

For instance, questions like “Is the unit plugged in?”, or “Is the power on?” are perfect questions to start with. While it would be wonderful to believe that everyone you encounter has the common sense to check out these simple solutions, you’ll find that, unfortunately, the majority of the population isn’t that bright.

So, how about a real-world example. It’s 2am and you get paged that a router has gone unreachable. After notifying the proper people, you delve into the problem. Using the Occam’s Razor principle, what’s the first thing you should check? Well, for starters, let’s make sure the router really is unreachable. A simple ping should accomplish that. And just for good measure, ping something close to that router just to make sure you’re connected to the network.

Ok, so the router isn’t pingable, now what? Well, let’s look at the next easiest step, power. Since the router is in a remote location, this isn’t easy to check. However, you can check the uplink on the router. You should be able to get to the router just before the one that’s unreachable. Once there, check the interface that feeds your troubled router. Is it up or down? While you’re there, you can check for traffic and errors as well, but don’t focus on these yet, store them for later.

If the interface is down, then it’s quite possibly a physical line issue or, possibly, power. Just for good measure, I would suggest bouncing the interface to see if it’s something temporary. Sometimes, the interface will come back up and start running errors, indicating a physical line issue. What will often happen is that the interface comes back up and starts running errors, but allows limited traffic to get through. Once the error threshold is passed, the line goes back down. At this point, I’d call a technical to look at the physical line itself.

If the interface is up, try pinging the troubled router from the directly connected router. This process can help identify a routing issue in the network. Directly connected interfaces are considered to be the most specific route unless specifically overridden, which isn’t likely. If the ping is successful, take note of the ping time. If it seems overly high, you may be looking at a traffic issue. Depending on the type of router, traffic may be processor switched and cause high CPU usage. This can be identified by a sluggish interface and high ping times. Notes, high ping times don’t always indicate this. Most routers set a very low priority for ICMP traffic destined for the CPU, deeming throughput more important.

Remember the traffic and error counts you looked at previously? Those come into play now. If the traffic on the interface is very high, notably higher than usual, then this is likely the cause of the problem. Or, rather, an effect of the actual cause which may be a DoS attack or Virus outbreak. DoS, or Denial of Service, attacks are targeted attacks against a specific IP or range of IPs. A side effect of these attacks is that interfaces between the attacker and victim are often overloaded.

There are a number of different DoS attacks out there, but often when you see traffic as the cause of the DoS, you’ll notice that small packets are being used. One way to quickly identify this is to take the current bps on the interface, divide it by the packets per second, and then by 8 to get bytes per packet. Generally speaking, a normal interface ranges average packet size between 1000 and 1500 bytes. NOTE : This is referring to traffic received from a remote source such as a web site. Outgoing traffic, to the website, has a much lower average packet size because these packets generally contain control information such as acknowledgements, ICMP, etc.

Once you’ve identified that there is a traffic issue, the next step is to identify where the traffic is sourced from, or destined to. Remember, the end-goal here is to repair the problem so that normal operations can continue. Since you’re already aware of the overloaded interface, it’s easiest to concentrate your efforts there. Identifying the traffic source and destination is usually pretty easy, provided it’s not a distributed attack. On a Cisco router, you can try the “IP accounting” command. This command will show the source and destination for all output packets on an interface. Included is a count of the number of packets and the bits used by those packets. Simply look for rapidly increasing source and destination pairs and you’ll likely find your culprit.

Another option is to use an access list. If the router can handle it, place an access list on the interface that passes all traffic, but logs each packet. Then you can watch the log and try to identify large sources of traffic. Refine the access list to block that traffic until you’ve halted the attack. Be careful, however, as many routers will processor switch the traffic when an access-list is applied. This may cause a spike in CPU usage, sometimes causing a loss of connectivity to the router. If IP accounting is available, use that instead.

Once you identify the source and/or target of the attack, craft an appropriate access list to block the traffic as far upstream as you can. If the DoS attack is distributed, then the most effective means to stop the attack is probably to remove the targeted routes from the routing table and allow it to be blocked at the edges. This will likely result in an outage for that specific customer, but with a distributed attack, that’s often the only solution. From there you can work with your upstream providers to track down the perpetrator of the attack and take it offline permanently.

The preceding seems a bit long when written down, but in reality, this is a 15-30 minute process. Experienced troubleshooters can identify and resolve these problems even quicker. The point, of course, is to identify the most likely causes in the quickest manner possible. Often times, the simplest solution is the correct solution. Take the extra few seconds to check out the obvious before moving on to the more advanced. Often, you’ll resolve the solution quicker and sometimes wind up with a funny story as a bonus!

Please, troubleshoot responsibly.

Network Graphing

Visual representations of data can provide additional insight into the inner workings of your network. Merely knowing that one of your main feeds is peaking at 80% utilization isn’t very helpful when you don’t know how long the peak is, at what time, and when it started.

There are a number of graphing solutions available. Some of these are extremely simplistic and don’t do much, while others are overly powerful and provide almost too much. I prefer using Cacti for my graphing needs.

Cacti is a web-based graphing solution built on top of RRDtool. RRDtool is a round-robin data logging and graphing tool developed by Tobias Oetiker of MRTG fame, MRTG being one of the original graphing systems.

Chock full of features, Cacti allows data collection from almost anywhere. It supports SNMP and script-based collection by default, but additional methods can easily be added. Graphs are fully configurable and can display just about any information you want. You can combine multiple sources on a single graph, or create multiple graphs for better resolution. Devices, once added, can be arranged into a variety of hierarchies allowing multiple views for various users. Security features allow the administrator to tailor the data shown to each user.

Cacti is a wonderful tool to have and is invaluable when it comes to tracking down problems with the network. The ability to graph anything that spits out data makes it incredibly useful. For instance, you can create graphs to show you the temperature of equipment, utilization of CPUs, even the number of emails being sent per minute! The possibilities are seemingly endless.

There is a slight learning curve, however. Initial setup is pretty simple, and adding devices is straightforward. The tough part is understanding how Cacti gathers data and relates it all together. There are some really good tutorials on their documentation site that can help you through this part.

Overall, I think Cacti is one of the best graphing tools out there. The graphs come out very professional looking, and the feature set is amazing. Definitely worth looking into.