This post first appeared on Redhat’s Enable Sysadmin community. You can find the post here.
I’ve spent a career building networks and servers, deploying, troubleshooting, and caring for applications. When there’s a network problem, be it outages or failed deployments, or you’re just plain curious about how things work, three simple tools come to mind: ping, traceroute, and netstat.
Ping
Ping is quite possibly one of the most well known tools available. Simply put, ping sends an “are you there?” message to a remote host. If the host is, in fact, there, it returns a “yup, I’m here” message. It does this using a protocol known as ICMP, or Internet Control Message Protocol. ICMP was designed to be an error reporting protocol and has a wide variety of uses that we won’t go into here.
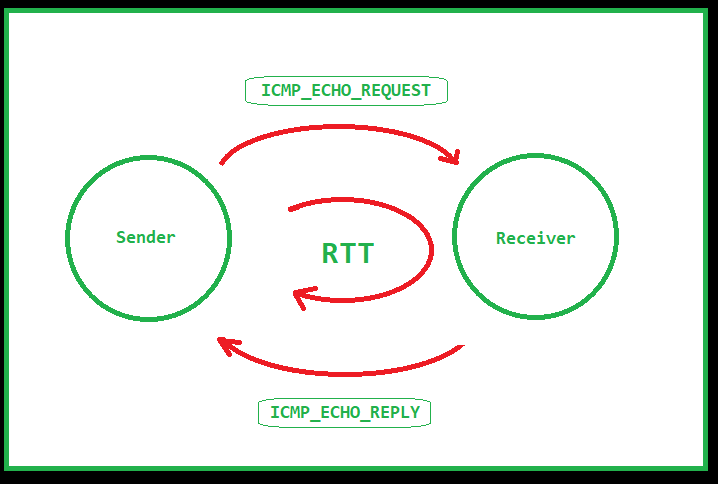
Ping uses two message types of ICMP, type 8 or Echo Request and type 0 or Echo Reply. When you issue a ping command, the source sends an ICMP Echo Request to the destination. If the destination is available, and allowed to respond, then it replies with an ICMP Echo Reply. Once the message returns to the source, the ping command displays a success message as well as the RTT or Round Trip Time. RTT can be an indicator of the latency between the source and destination.
Note: ICMP is typically a low priority protocol meaning that the RTT is not guaranteed to match what the RTT is to a higher priority protocol such as TCP.
When the ping command completes, it displays a summary of the ping session. This summary tells you how many packets were sent and received, how much packet loss there was, and statistics on the RTT of the traffic. Ping is an excellent first step to identifying whether or not a destination is “alive” or not. Keep in mind, however, that some networks block ICMP traffic, so a failure to respond is not a guarantee that the destination is offline.
 $ ping google.com
PING google.com (172.217.10.46): 56 data bytes
64 bytes from 172.217.10.46: icmp_seq=0 ttl=56 time=15.740 ms
64 bytes from 172.217.10.46: icmp_seq=1 ttl=56 time=14.648 ms
64 bytes from 172.217.10.46: icmp_seq=2 ttl=56 time=11.153 ms
64 bytes from 172.217.10.46: icmp_seq=3 ttl=56 time=12.577 ms
64 bytes from 172.217.10.46: icmp_seq=4 ttl=56 time=22.400 ms
64 bytes from 172.217.10.46: icmp_seq=5 ttl=56 time=12.620 ms
^C
--- google.com ping statistics ---
6 packets transmitted, 6 packets received, 0.0% packet loss
round-trip min/avg/max/stddev = 11.153/14.856/22.400/3.689 ms
The example above shows a ping session to google.com. From the output you can see the IP address being contacted, the sequence number of each packet sent, and the round trip time. 6 packets were sent with an average RTT of 14ms.
One thing to note about the output above and the ping utility in general. Ping is strictly an IPv4 tool. If you’re testing in an IPv6 network you’ll need to use the ping6 utility. The ping6 utility works roughly identical to the ping utility with the exception that it uses IPv6.
Traceroute
Traceroute is a finicky beast. The premise is that you can use this tool to identify the path between a source and destination point. That’s mostly true, with a couple of caveats. Let’s start by explaining how traceroute works.
Think of traceroute as a string of ping commands. At each step along the path, traceroute identifies the IP of the hop as well as the latency to that hop. But how is it finding each hop? Turns out, it’s using a bit of trickery.
Traceroute uses UDP or ICMP, depending on the OS. On a typical *nix system it uses UDP by default, sending traffic to port 33434 by default. On a Windows system it uses ICMP. As with ping, traceroute can be blocked by not responding to the protocol/port being used.
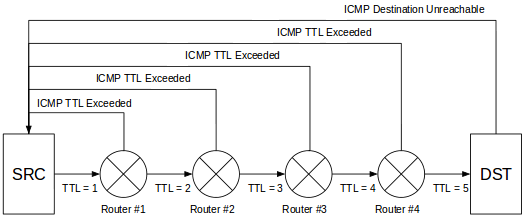
When you invoke traceroute you identify the destination you’re trying to reach. The command begins by sending a packet to the destination, but it sets the TTL of the packet to 1. This is significant because the TTL value determines how many hops a packet is allowed to pass through before an ICMP Time Exceeded message is returned to the source. The trick here is to start the TTL at 1 and increment it by 1 after the ICMP message is received.
$ traceroute google.com
traceroute to google.com (172.217.10.46), 64 hops max, 52 byte packets
 1  192.168.1.1 (192.168.1.1)  1747.782 ms  1.812 ms  4.232 ms
 2  10.170.2.1 (10.170.2.1)  10.838 ms  12.883 ms  8.510 ms
 3  xx.xx.xx.xx (xx.xx.xx.xx)  10.588 ms  10.141 ms  10.652 ms
 4  xx.xx.xx.xx (xx.xx.xx.xx)  14.965 ms  16.702 ms  18.275 ms
 5  xx.xx.xx.xx (xx.xx.xx.xx)  15.092 ms  16.910 ms  17.127 ms
 6  108.170.248.97 (108.170.248.97)  13.711 ms  14.363 ms  11.698 ms
 7  216.239.62.171 (216.239.62.171)  12.802 ms
    216.239.62.169 (216.239.62.169)  12.647 ms  12.963 ms
 8  lga34s13-in-f14.1e100.net (172.217.10.46)  11.901 ms  13.666 ms  11.813 ms
Traceroute displays the source address of the ICMP message as the name of the hop and moves on to the next hop. When the source address matches the destination address, traceroute has reached the destination and the output represents the route from the source to the destination with the RTT to each hop. As with ping, the RTT values shown are not necessarily representative of the real RTT to a service such as HTTP or SSH. Traceroute, like ping, is considered to be lower priority so RTT values aren’t guaranteed.
There is a second caveat with traceroute you should be aware of. Traceroute shows you the path from the source to the destination. This does not mean that the reverse is true. In fact, there is no current way to identify the path from the destination to the source without running a second traceroute from the destination. Keep this in mind when troubleshooting path issues.
Netstat
Netstat is an indispensable tool that shows you all of the network connections on an endpoint. That is, by invoking netstat on your local machine, all of the open ports and connections are shown. This includes connections that are not completely established as well as connections that are being torn down.
$ sudo netstat -anptu
Active Internet connections (servers and established)
Proto Recv-Q Send-Q Local Address           Foreign Address         State       PID/Program name
tcp        0      0 0.0.0.0:25              0.0.0.0:*               LISTEN      4417/master
tcp        0      0 0.0.0.0:443             0.0.0.0:*               LISTEN      2625/java
tcp        0      0 192.168.1.38:389        0.0.0.0:*               LISTEN      559/slapd
tcp        0      0 0.0.0.0:22              0.0.0.0:*               LISTEN      1180/sshd
tcp        0      0 192.168.1.38:37190      192.168.1.38:389        ESTABLISHED 2625/java
tcp        0      0 192.168.1.38:389        192.168.1.38:45490      ESTABLISHED 559/slapd
The output above shows several different ports in a listening state as well as a few established connections. For listening ports, if the source address is 0.0.0.0, it is listening on all available interfaces. If there is an IP address instead, then the port is open only on that specific interface.
The established connections show the source and destination IPs as well as the source and destination ports. The Recv-Q and Send-Q fields show the number of bytes pending acknowledgement in either direction. Finally, the PID/Program name field shows the process ID and the name of the process responsible for the listening port or connection.
Netstat also has a number of switches that can be used to view other information such as the routing table or interface statistics. Both IPv4 and IPv6 are supported. There are switches to limit to either version, but both are displayed by default.
In recent years, netstat has been superseded by the ss command. You can find more information on the ss command in this post by Ken Hess.
Conclusion
As you can see, these tools are invaluable when troubleshooting network issues. As a network or systems administrator, I highly recommend becoming intimately familiar with these tools. Having these available may save you a lot of time troubleshooting.