We will entangle buds and flowers and beams
Which twinkle on the fountain’s brim, and make
Strange combinations out of common things
“Prometheus Unbound” by Percy Bysshe Shelley
This post first appeared on Redhat’s Enable Sysadmin community. You can find the post here.
Welcome to the world of metrics collection and performance monitoring. As with most things IT, entire market sectors have been built to sell these tools. And, of course, there are a number of open source tools that serve the same purpose. It’s one of these open source tools that we’re going to take a look at.
What is Prometheus?
Prometheus is a metrics collection and alerting tool developed and released to open source by SoundCloud. Prometheus is similar in design to Google’s Borgmon monitoring system and a relatively modest system can handle collecting hundreds of thousands of metrics every second. Properly tuned and deployed, a Prometheus cluster can collect millions of metrics every second.
Prometheus is made up of roughly four parts:
- The main Prometheus app itself that is responsible for scraping metrics, storing them in the database, and (optionally) retrieving them when queried.
- The database backend is an internal Time Series database. This database is always used, but data can also be sent to remote storage backends.
- Exporters are optional external programs that ingest data from a variety of sources and convert it to metrics that Prometheus can scrape.
- Exporters are purpose built applications for working with specific applications and hardware.
- AlertManager is an alert management system. It ships with Prometheus.
- Client Libraries that can be used to instrument custom applications.
I say “roughly” four parts because there are plenty of additional applications that are often used with a standard Prometheus cluster. If you need or want better graphing capabilities, applications like Grafana can be deployed. If you need to store metrics for long periods of time, remote storage backends are worth looking into. And the list goes on. For the purposes of this article, however, we’re going to focus on Prometheus itself with a small detour into exporters.
What is a metric?
But before we get there, we need to understand why something like Prometheus exists. So let’s start with a question. What are metrics? Simply put, metrics measure something. For instance, the time it takes you to read this article is a metric. The number or words is a metric. The average number of letters in the words of this article is a metric.
But those metrics are fairly static and not something you’d necessarily need a system like Prometheus for. Prometheus excels at metrics that change over time. For instance, what if you wanted to know how many “views” this article is getting? Or what if you wanted to know how much traffic was entering and leaving your network? Or how many build and deploy cycles are happening each hour? All of these are metrics that can be fed into Prometheus.
Now that we understand what a metric is, let’s take a look at how Prometheus gets the metrics it needs to store. The first thing Prometheus needs is a target. Targets are the endpoints that supply the metrics that Prometheus stores. These endpoints can be the actual endpoint being monitored or they can be a piece of middleware known as an exporter. Endpoints can be supplied via a static configuration or they can be “found” through a process called service discovery. Service Discovery is a more advanced topic and will be covered in a future article.
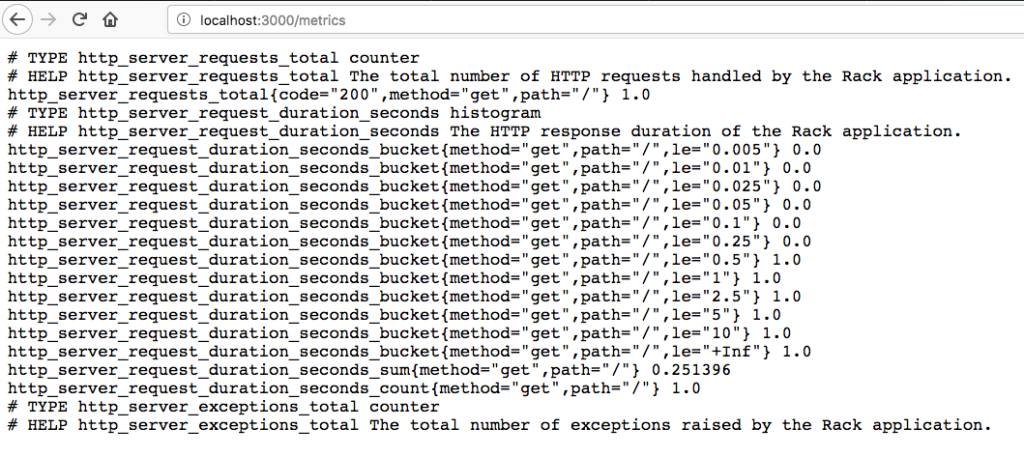
Once Prometheus has a list of endpoints, it can begin to retrieve metrics from them. Prometheus retrieves metrics in a very straightforward manner, a simple HTTP request. The configuration points at a specific location on the endpoint that will supply a stream of text identifying the metric and its current value. Prometheus reads this stream of text, ignoring lines beginning with a # as comments, and stores the metrics it receives in a local database.
A short sidetrack into Exporters
Prometheus can only talk HTTP to endpoints for metrics collection. So what happens when you’re trying to monitor a router or switch that only communicates using SNMP? Or perhaps you want to monitor a cloud service that doesn’t have a native Prometheus metrics endpoint? Fortunately, there’s a solution. Exporters.
Exporters come in many shapes and sizes. These are small, purpose-built programs designed to stand between Prometheus and anything you want to monitor that doesn’t natively support Prometheus. Some exporters sit idle until Prometheus polls them for data. When this happens, the exporter reaches out to the device it’s monitoring, gets the relevant data, and converts it to a format that Prometheus can ingest. Other exporters poll devices automatically, caching the results locally for Prometheus to pick up later.
Regardless of design, exporters act as a translator between Prometheus and endpoints you want to monitor. Chances are, if you’re trying to monitor a common device or application, there’s an exporter out there for it.
Data Storage
Prometheus uses a special type of database on the back end known as a time series database. Simply put, this database is optimized to store and retrieve data organized as values over a period of time. Metrics are an excellent example of the type of data you’d store in such a database.
External storage is also an option. There are many options such as Thanos, Cortex, and VictoriaMetrics that provide a variety of benefits. One of the primary benefits is to centralize the gathered metrics and allow for long term storage. Tools such as Grafana can query these third party storage solutions directly.
So you have a bunch of metrics…
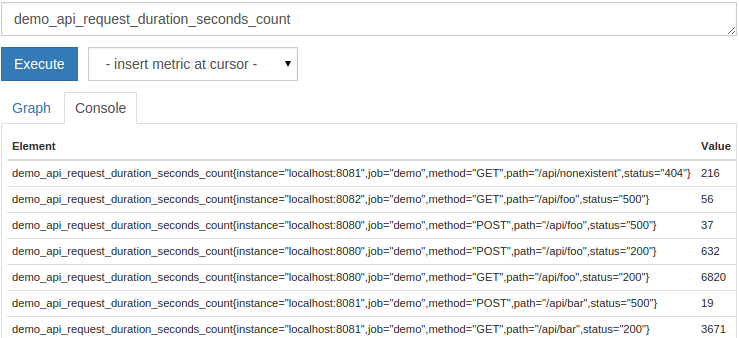
Now that you’re an expert on Prometheus and you have it storing metrics, how do you use this data? Much like a SQL database, Prometheus has a custom query language known as PromQL. PromQL is pretty straightforward for simple metrics but has a lot of complexity when needed. Simply supplying the name of a metric will show all “instances” of that metric:
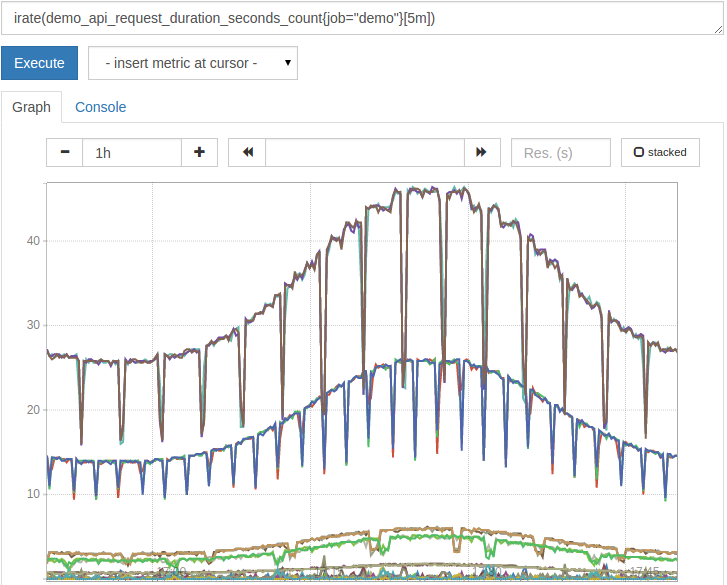
Or you can use some PromQL methods and generate a graph representing the data you’re after.
Of course, if you’re serious about graphing, it’s worth looking into a package such as Grafana. Grafana allows you to create dashboards of metrics, send alerts, and more.
Alerting
While graphs are pretty to look at, metrics can serve another, important, purpose. They can be used to send alerts. Prometheus includes a separate application, called AlertManager, that serves this purpose. AlertManager receives notifications from Prometheus and handles all of the necessary logic to dedupe and deliver the alerts.
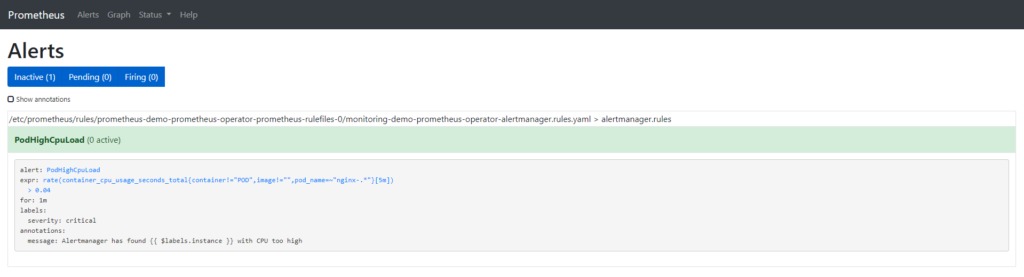
Alerts are created by writing alert rules. These rules are simply PromQL queries that fire when the query is true. That is, if you have a query that checks if the temperature on the cpu is over 80C then the query fires for each metric that meets that condition.
Alert rules can also include a time period over which a rule must evaluate to true. Expanding on our temperature example, exceeding 80C is ok if it’s a brief period of time. But if it lasts more than 5 minutes, send an alert. Alerts can be sent via email, slack, twitter, sms, and pretty much anything else you can write an interface for.
Wrap Up
Monitoring is important. It helps identify when things have gone wrong and it can show when things are going right. Proper monitoring can be used across a variety of disciplines to squeeze everything you can out of the object being monitored.
Prometheus is a powerful open-source metrics package. It is highly scalable, robust, and extremely fast. A single modern server can be used to monitor a million metrics or more per second. Distributing Prometheus servers allows for many tens and even hundreds of millions of metrics to be monitored every second.
PromQL provides a robust querying language that can be used for graphing as well as alerting. The built-in graphing system is great for quick visualizations but longer term dashboarding should be handled in external applications such as Grafana.