Ok, I’ve done it. I’ve installed the ActivityPub plugin and put this blog on the Fediverse. Why? Well, it’s new, it’s interesting, and I really want to see the Fediverse grow.
What is the Fediverse, you ask? Well, in a nutshell, it’s a network comprised of various types of social networks that use a common protocol to talk between them. That protocol is ActivityPub.
There are tons of different types of social networks you can use. Mastodon is the primary one folks know about. Mastodon is a social network similar to Twitter, Bluesky, etc. But there are others.
PeerTube is a Youtube style network for hosting videos.
PixelFed is an image sharing network. Think Imgur or Instagram.
Lemmy is a conversation platform similar to Reddit.
And there are a TON more! Each of these is an app you can run on your own, thus owning your own content and making whatever choices you want with respect to the content. And if you’re not interested in running your own instance, there are plenty of instances out there that you can join.
Right now I’m just experimenting to see how this works with a blog on the Fediverse, but I’m hoping it works out and I can get back to blogging on a regular basis.
This post first appeared on Redhat’s Enable Sysadmin community. You can find the post here.
Welcome to the world of metrics collection and performance monitoring. As with most things IT, entire market sectors have been built to sell these tools. And, of course, there are a number of open source tools that serve the same purpose. It’s one of these open source tools that we’re going to take a look at.
What is Prometheus?
Prometheus is a metrics collection and alerting tool developed and released to open source by SoundCloud. Prometheus is similar in design to Google’s Borgmon monitoring system and a relatively modest system can handle collecting hundreds of thousands of metrics every second. Properly tuned and deployed, a Prometheus cluster can collect millions of metrics every second.
Prometheus is made up of roughly four parts:
The main Prometheus app itself that is responsible for scraping metrics, storing them in the database, and (optionally) retrieving them when queried.
The database backend is an internal Time Series database. This database is always used, but data can also be sent to remote storage backends.
Exporters are optional external programs that ingest data from a variety of sources and convert it to metrics that Prometheus can scrape.
Exporters are purpose built applications for working with specific applications and hardware.
AlertManager is an alert management system. It ships with Prometheus.
Client Libraries that can be used to instrument custom applications.
I say “roughly” four parts because there are plenty of additional applications that are often used with a standard Prometheus cluster. If you need or want better graphing capabilities, applications like Grafana can be deployed. If you need to store metrics for long periods of time, remote storage backends are worth looking into. And the list goes on. For the purposes of this article, however, we’re going to focus on Prometheus itself with a small detour into exporters.
What is a metric?
But before we get there, we need to understand why something like Prometheus exists. So let’s start with a question. What are metrics? Simply put, metrics measure something. For instance, the time it takes you to read this article is a metric. The number or words is a metric. The average number of letters in the words of this article is a metric.
But those metrics are fairly static and not something you’d necessarily need a system like Prometheus for. Prometheus excels at metrics that change over time. For instance, what if you wanted to know how many “views” this article is getting? Or what if you wanted to know how much traffic was entering and leaving your network? Or how many build and deploy cycles are happening each hour? All of these are metrics that can be fed into Prometheus.
Now that we understand what a metric is, let’s take a look at how Prometheus gets the metrics it needs to store. The first thing Prometheus needs is a target. Targets are the endpoints that supply the metrics that Prometheus stores. These endpoints can be the actual endpoint being monitored or they can be a piece of middleware known as an exporter. Endpoints can be supplied via a static configuration or they can be “found” through a process called service discovery. Service Discovery is a more advanced topic and will be covered in a future article.
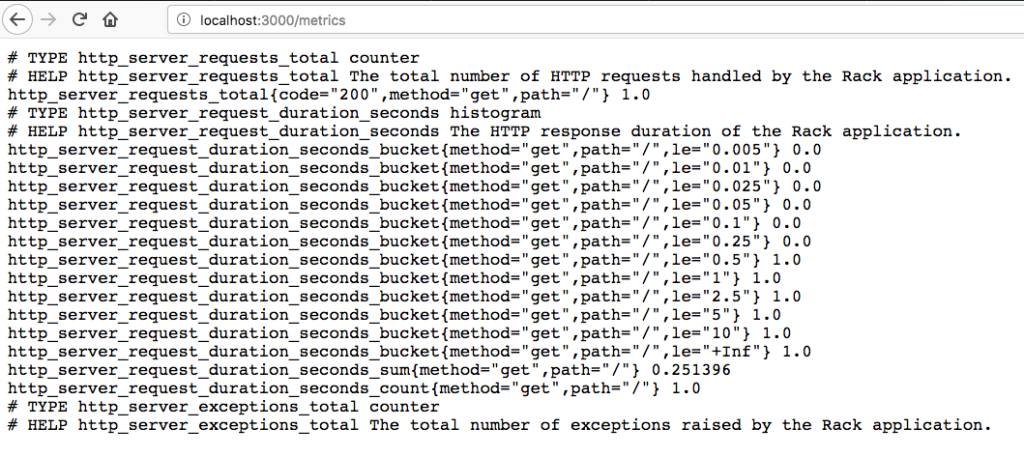
Once Prometheus has a list of endpoints, it can begin to retrieve metrics from them. Prometheus retrieves metrics in a very straightforward manner, a simple HTTP request. The configuration points at a specific location on the endpoint that will supply a stream of text identifying the metric and its current value. Prometheus reads this stream of text, ignoring lines beginning with a # as comments, and stores the metrics it receives in a local database.
Prometheus can only talk HTTP to endpoints for metrics collection. So what happens when you’re trying to monitor a router or switch that only communicates using SNMP? Or perhaps you want to monitor a cloud service that doesn’t have a native Prometheus metrics endpoint? Fortunately, there’s a solution. Exporters.
Exporters come in many shapes and sizes. These are small, purpose-built programs designed to stand between Prometheus and anything you want to monitor that doesn’t natively support Prometheus. Some exporters sit idle until Prometheus polls them for data. When this happens, the exporter reaches out to the device it’s monitoring, gets the relevant data, and converts it to a format that Prometheus can ingest. Other exporters poll devices automatically, caching the results locally for Prometheus to pick up later.
Regardless of design, exporters act as a translator between Prometheus and endpoints you want to monitor. Chances are, if you’re trying to monitor a common device or application, there’s an exporter out there for it.
Data Storage
Prometheus uses a special type of database on the back end known as a time series database. Simply put, this database is optimized to store and retrieve data organized as values over a period of time. Metrics are an excellent example of the type of data you’d store in such a database.
External storage is also an option. There are many options such as Thanos, Cortex, and VictoriaMetrics that provide a variety of benefits. One of the primary benefits is to centralize the gathered metrics and allow for long term storage. Tools such as Grafana can query these third party storage solutions directly.
So you have a bunch of metrics…
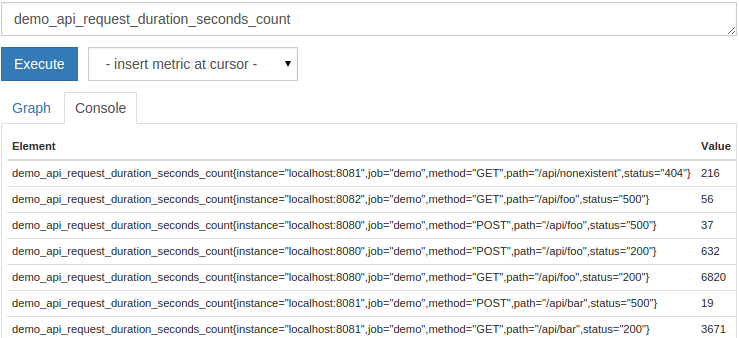
Now that you’re an expert on Prometheus and you have it storing metrics, how do you use this data? Much like a SQL database, Prometheus has a custom query language known as PromQL. PromQL is pretty straightforward for simple metrics but has a lot of complexity when needed. Simply supplying the name of a metric will show all “instances” of that metric:
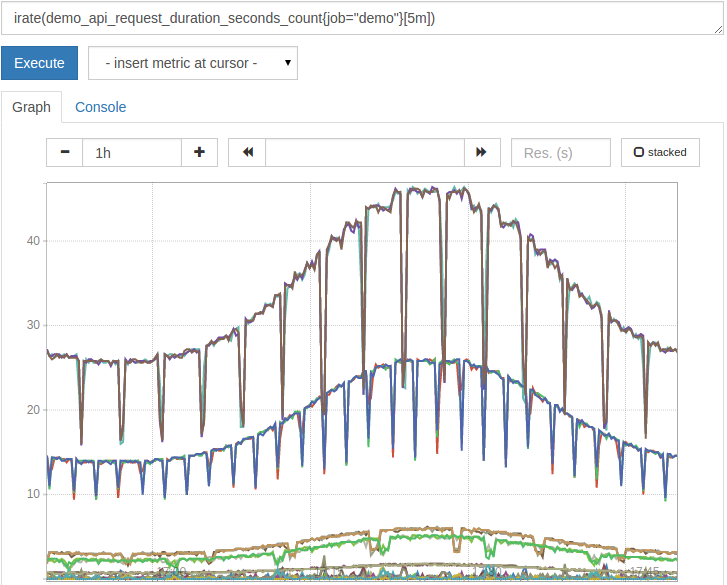
Of course, if you’re serious about graphing, it’s worth looking into a package such as Grafana. Grafana allows you to create dashboards of metrics, send alerts, and more.
Alerting
While graphs are pretty to look at, metrics can serve another, important, purpose. They can be used to send alerts. Prometheus includes a separate application, called AlertManager, that serves this purpose. AlertManager receives notifications from Prometheus and handles all of the necessary logic to dedupe and deliver the alerts.
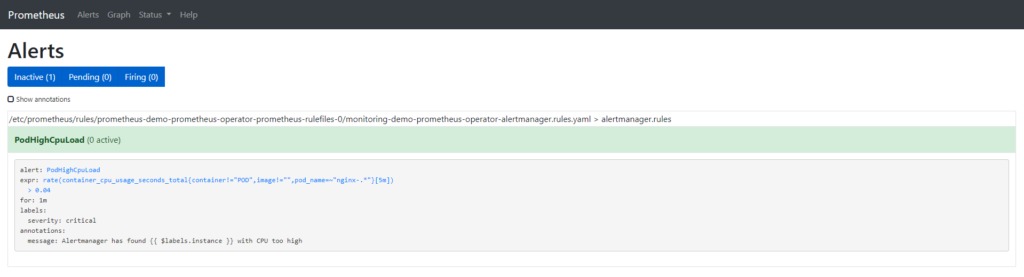
Alerts are created by writing alert rules. These rules are simply PromQL queries that fire when the query is true. That is, if you have a query that checks if the temperature on the cpu is over 80C then the query fires for each metric that meets that condition.
Alert rules can also include a time period over which a rule must evaluate to true. Expanding on our temperature example, exceeding 80C is ok if it’s a brief period of time. But if it lasts more than 5 minutes, send an alert. Alerts can be sent via email, slack, twitter, sms, and pretty much anything else you can write an interface for.
Monitoring is important. It helps identify when things have gone wrong and it can show when things are going right. Proper monitoring can be used across a variety of disciplines to squeeze everything you can out of the object being monitored.
Prometheus is a powerful open-source metrics package. It is highly scalable, robust, and extremely fast. A single modern server can be used to monitor a million metrics or more per second. Distributing Prometheus servers allows for many tens and even hundreds of millions of metrics to be monitored every second.
PromQL provides a robust querying language that can be used for graphing as well as alerting. The built-in graphing system is great for quick visualizations but longer term dashboarding should be handled in external applications such as Grafana.
This post first appeared on Redhat’s Enable Sysadmin community. You can find the post here.
One of the first industry jobs I ever had was for a small regional ISP. At the time, 56k modems were shiny and new. We had a couple dozen PoPs (Points of Presence) where we installed banks of modems and fed the data back to our main office via a series of full and fractionalT1 lines.
We provided the typical slew of services: email, net news, and general internet access. Of course, to provide these services we needed servers of our own. The solution was to set up a cluster of SCO UNIX systems. Yes, *that* SCO. It’s been quite a while, but a cluster setup like this is hard to forget. The servers were set up in such a way that they had dependencies on each other. If one failed, it didn’t cause everything to come crashing down, but getting that one server back up generally required restarting everything.
The general setup was that the servers nfs mounted each other on startup. This, of course, causes a race condition during startup. The engineers had written a detailed document that explained the steps required to bring the entire cluster up after a failure. The entire process usually took 30-45 minutes.
At the time, I was a lowly member of tech support, spending the majority of my time hand-holding new customers through the process of installing the software necessary to get online. I was relatively new to the world of Unix and high speed networking and sucking up as much knowledge as I could.
One of the folks I worked with, Brett, taught me a lot. He wrote the network monitoring system we used and spent his time between that and keeping the network up and running. He was also a bit of a prankster at times.
At the end of one pretty typical day, I happened to be on the unix cluster. Out of the blue, my connection failed and I was booted back to my local OS. This was a bit weird, but it happened occasionally so I simply logged back in. Within a few seconds I was booted out again.
I started doing a bit of debugging, trying to figure out what was going on. I don’t remember everything that I did, but I do remember putting together some quick scripts to log in, check various processes, and try ot figure out what was happening. At some point I determined that I was being booted off the system by another user, Brett.
Once I figured out what was going on, I had to fight back. So I started playing around with shell scripting, trying to figure out how to identify what the pid of his shell was so I could boot him offline. This went back and forth for a bit, each of us escalating the attacks. We started using other services to regain access, launch attacks, etc.
That is, until I launched what I thought would be the ULTIMATE attack. I wrote a small shell script that searched for his login, identified the shell, and subsequently killed his access. Pretty simple, but I added the ultimate twist. After the script ran, it ran a copy of itself. BOOM. No way he can get back on now.
And it worked! Brett lost his access and simply could not gain a foothold over the next 5 or so minutes. And, of course, I had backgrounded the task so I could interact with the console and verify that he was beaten. I had won. I had proven that I could beat the experienced engineer and damn, I felt good about it.
Until…
ksh: fork: Resource temporarily unavailable
The beginning of the end
I had never seen such an error before. What was this? Why was the system doing this? And why was it streaming all over my console, making it impossible for me to do anything?
It took a few moments but Brett noticed the problem as well. He came out to see what had happened. I explained my brilliant strategy and he simply sighed, smiled, and told me I’d have to handle rebooting and re-syncing the servers. And then he took the time to explain to me what I had done wrong. That was the day I learned about “exec” and how important it is.
Unfortunately, Brett passed away about a decade or so after this. He was a great friend, a great mentor, and I miss him.
“The advantage of a bad memory is that one enjoys several times the same good things for the first time.”
Friedrich Nietzsche
This post first appeared on Redhat’s Enable Sysadmin community. You can find the post here.
Memory is a funny construct. What we remember is often not what happened, or even the order it happened in. One of the earliest memories I have about technology was a trip my father and I took. We drove to Manhattan, on a mission to buy a Christmas gift for my mother. This crazy new device, The Itty Bitty Book Light, had come out recently and, being an avid reader, my mother had to have one.
We drove to Manhattan, on a mission to buy a Christmas gift for my mother. This crazy new device, The Itty Bitty Book Light, had come out recently and, being an avid reader, my mother had to have one.
After navigating the streets of Manhattan and finding a parking spot, we walked down the block to what turned out to be a large bookstore. You’ve seen bookstores like this on TV and in the movies. It looks small from the outside, but once you walk in, the store is endless. Walls of books, sliding ladders, tables with books piled high. It was pretty incredible, especially for someone like me who loves reading.
But in this particular store, there was something curious going on. One of the tables was surrounded by adults, awed and whispering between one another. Unsure of what was going on, we approached. After pushing through the crowd, what I saw drew me in immediately. On the table, surrounded by books, was a small grey box, the Apple Macintosh. It was on, but no one dared approach it. No one, that is, except me. I was drawn like a magnet, immediately grokking that the small puck like device moved the pointer on the screen. Adults gasped and murmured, but I ignored them all and delved into the unknown. The year was, I believe, 1984.
Somewhere around the same time, though likely a couple years before, my father brought home a TI-99/4A computer. From what I remember, the TI had just been released, so this has to be somewhere around 1982. This machine served as the catalyst for my love of computer technology and was one of the first machines I ever cut code on.
My father tells a story about when I first started programming. He had been working on an inventory database, written from scratch, that he built for his job. I would spend hours looking over his shoulder, absorbing everything I saw. One time, he finished coding, saved the code, and started typing the command to run his code (“RUN”). Accordingly to him, I stopped him with a comment that his code was going to fail. Ignoring me as I was only 5 or 6 at the time (according to his recollection), he ran the code and, as predicted, it failed. He looked at me with awe and I merely looked back and replied “GOSUB but no RETURN”.
At this point I was off and running. Over the years I got my hands on a few other systems including the Timex Sinclair, Commodore 64 and 128, TRS-80, IBM PS/2, and finally, my very own custom built PC from Gateway 2000. Since them I’ve built hundreds of machines and spend most of my time on laptops now.
The Commodore 64 helped introduce me to the online world of Bulletin Board Systems. I spent many hours, much to the chagrin of my father and the phone bill, calling into various BBS systems in many different states. Initially I was just there to play the various door games that were available, but eventually discovered the troves of software available to download. Trading software become a big draw until I eventually stumbled upon the Usenet groups that some boards had available. I spent a lot of time reading, replying, and even ended up in more than one flame war.
My first introduction to Unix based operating systems was in college when I encountered an IBM AIX mainframe as well as a VAX. I also had access to a shell account at the local telephone company turned internet service provider. The ISP I was using helpfully sent out an email to all subscribers about the S.A.T.A.N. toolkit and how accounts found with the software in their home directories would be immediately banned. Being curious, I immediately responded looking for more information. And while my account was never banned, I did learn a lot.
At the same time, my father and I started our own BBS which grew into a local Internet Service Provider offering dial-up services. That company still exists today, though the dial-up service died off several years ago. This introduced me to networks and all the engineering that comes along with it.
From here my journey takes a bit of a turn. Since I was a kid, I’ve wanted to build video games. I’ve read a lot of books on the subject, talked to various developers (including my idol, John Carmack) and written a lot of code. I actually wrote a pacman clone, of sorts, on the Commodore 64 when I was younger. But, alas, I think I was born on the wrong coast. All of the game companies, at the time, were located on the west coast and I couldn’t find a way to get there. So, I redirected my efforts a bit and focused on the technology I could get my hands on.
Running a BBS, and later an ISP, was a great introduction into the world of networking. After working a few standard school-age jobs (fast food, restaurants, etc), I finally found a job doing tech support for an ISP. I paid attention, asked questions, and learned everything I could. I took initiative where I could, even writing a cli-based ticketing system with an mSQL database backing it.
This initiative paid of as I was moved later to the NOC and finally to Network Engineering. I lead the way, learning everything I could about ATM and helping to design and build the standard ATM-based node design used by the company for over a decade. I took over development of the in-house monitoring system, eventually rewriting it in KSH and, later, Perl. I also had a hand in development of a more modern ticketing system written in Perl that is still in use today.
I spent 20+ years as a network engineer, taking time along the way to ensure that we had Linux systems available for the various scripting and monitoring needed to ensure the network performed as it should. I’ve spent many hours writing code in shell, expect, perl, and other languages to automate updates and monitoring. Eventually, I found myself looking for a new role and a host of skills ranging from network and systems administration to coding and security.
About this time, DevOps was quickly becoming the next new thing. Initially I rejected the idea, solely responding to the “Development” and “Operations” tags that make up the name. Over time, however, I came to realize that DevOps is yet another fancy name for what I’ve been doing for decades, albeit with a few twists here and there. And so, I took a role as a DevOps Engineer.
DevOps is a fun discipline, mixing in technologies from across the spectrum in an effort to automate away everything you can. Let the machine do the work for you and spent your time on more interesting projects like building more automation. And with the advent of containers and orchestration, there’s more to do than ever.
These days I find myself leading a team of DevOps engineers, both guiding the path we take as we implement new technology and automate existing processes. I also spend a lot of time learning about new technologies both on my own and for my day job. My trajectory seems to be changing slightly as I head towards the world of the SRE. Sort of like DevOps, but a bit heavier on the development side of things.
Life throws curves and sometimes you’re not able to move in the direction you want. But if you keep at it, there’s something out there for everyone. I still love learning and playing with technology. And who knows, maybe I’ll end up writing games at some point. There’s plenty of time for another new hobby.
This post first appeared on Redhat’s Enable Sysadmin community. You can find the post here.
“Intruder alert! Strace to PID 45555, log and store.” “Roger that, overseer. Target acquired.” “Status report!” “Suspicious activity verified, permission to terminate?” “Permission granted, deploy Sigkill.” “Process terminated at 2146 hours.”
Intrusion Prevention Systems, or IPS, are tools designed to detect and stop intrusions in their tracks. They come two basic flavors, network-based and host-based. As you may suspect, a network-based IPS is meant to be deployed to monitor the network and a host-based IPS is deployed on a host with the intention of monitoring just a single host.
How these tools work varies from vendor to vendor, but the basics are the same. The network-based tool monitors traffic on the network and matches it to a long list of known signatures. These signatures describe a variety of attacks ranging from simple corrupt packets to more specific attacks such as SQL injection.
Host-based tools tend to have more capabilities as they have access to the entire host. A host-based IPS can look at network traffic as well as monitor files and logs. One of the more popular tools, OSSEC-HIDS, monitors traffic, logs, file integrity, and even has signatures for common rootkits.
More advanced tools have additional detection capabilities such as statistical anomaly detection or stateful protocol inspection. Both of these capabilities use algorithms to detect intrusions. This allows detection of intrusions that don’t yet have signatures created for them.
IDS vs IPS
Unlike it’s predecessor, the Intrusion Detection System, or IDS, when an IPS detects an intrusion it moves to block the traffic and prevent it from getting to its target. As you can imagine, ensuring that the system blocks only bad traffic is of utmost importance. Deploying a tool that blocks legitimate traffic is a quick way to frustrate users and get yourself in trouble. An IDS merely detects the traffic and sends an alert. Given the volume of traffic on a typical network or host today, an IDS is of limited use.
The Redhat Enterprise Packages for Enterprise Linux repository includes two great HIDS apps that every admin should look into. HIDS apps are a bit of a hybrid solution in that they’re both an IDS and an IPS. That is, they can be configured to simply alert when they see issues or they can often be configured to run scripts to react to scenarios that trigger alerts.
Tripwire
First up from EPEL is Tripwire, a file integrity monitoring tool, which Seth Kenlonwrote about for Enable Sysadmin back in April. Tripwire’s job in life is to monitor files on the host and send an alert if they change in ways they’re not supposed to. For instance, you can monitor a binary such as /bin/bash and send an alert if the file changes in some way such as permissions or other attributes of the file. Attackers often modify common binaries and add a payload intended to keep their access to the server active. Tripwire can detect that.
fail2ban
The second EPEL package is fail2ban. Fail2ban is more of an IPS style tool in that it monitors and acts when it detects something awry. One common implementation of fail2ban is monitoring the openssh logs. By building a signature that identifies a failed login, fail2ban can detect multiple attempts to login from a single source address and block that source address. Typically, fail2ban does this by adding rules to the host’s firewall, but in reality, it can run any script you can come up with. So, for instance, you can write a script to block the IP on the local firewall and then transmit that IP to some central system that will distribute the firewall block to other systems. Just be careful, however, as globally blocking yourself from every system on the network can be rather embarrassing.
OSSEC
OSSEC-HIDS, mentioned previously, is a personal favorite of mine. It’s much more of a swiss army knife of tools. It combines tools like tripwire and fail2ban together into a single tool. It can be centrally managed and uses encrypted tunnels to communicate with clients. The community is very active and new signatures are created all the time. Definitely worth checking out.
Snort
Snort is a network-based IDS/IPS (NIDS/NIPS). Where HIDS are installed on servers with the intention of monitoring processes on the server itself, NIDS are deployed to monitor network traffic. Snort was first introduced in 1998 and has more recently been acquired by Cisco. Cisco has continued to support Snort as open source while simultaneously incorporating it into their product line.
Snort, like most NIDS/NIPS, works by inspecting each packet as it passes through the system. Snort can be deployed as an IDS by mirroring traffic to the system, or it can be deployed as an IPS by putting it in-line with traffic. In either case, Snort inspects the traffic and compares it to a set of signatures and heuristic patterns, looking for bad traffic. Snort’s signatures are updated on a regular basis and uses libpcap, the same library used by many popular network inspection tools such as tcpdump and wireshark.
Snort can also be configured to capture traffic for later inspection. Be aware, however, that this can eat up disk space pretty rapidly.
Suricata
Suricata is a relatively new IDS/IPS, released in 2009. Suricata is designed to be multi-threaded, making it much faster than competing products. Like Snort, it uses signatures and heuristic detection. In fact, it can use most Snort rules without any changes. It also has it’s own ruleset that allows it to use additional features such as file detection and extraction.
Zeek (Formerly Bro)
Bro was first release in 1994, making it one of the oldest IDS applications mentioned here. Originally named in reference to George Orwell’s book, 1984, more recent times have seen a re-branding to the arguably less offensive name, Zeek.
Zeek is often used as a network analysis tool but can also be deployed as an IDS. Like Snort, Zeek uses libpcap for packet capture. Once packets enter the system, however, any number of frameworks or scripts can be applied. This allows Zeek to be very flexible. Scripts can be written to be very specific, targeting specific types of traffic or scenarios, or Zeek can be deployed as an IDS, using various signatures to identify and report on suspect traffic.
Wrap-Up
One final word of caution. IPS tools are powerful and extremely useful in automating the prevention of intrusions. But like all tools, they need to be maintained properly. Ensure your signatures are up to date and monitor the reports coming from the system. It’s still possible for a skilled attacker to slip by these tools and gain access to your systems. Remember, there is no such thing as a security silver bullet.
This post first appeared on Redhat’s Enable Sysadmin community. You can find the post here.
I’ve spent a career building networks and servers, deploying, troubleshooting, and caring for applications. When there’s a network problem, be it outages or failed deployments, or you’re just plain curious about how things work, three simple tools come to mind: ping, traceroute, and netstat.
Ping
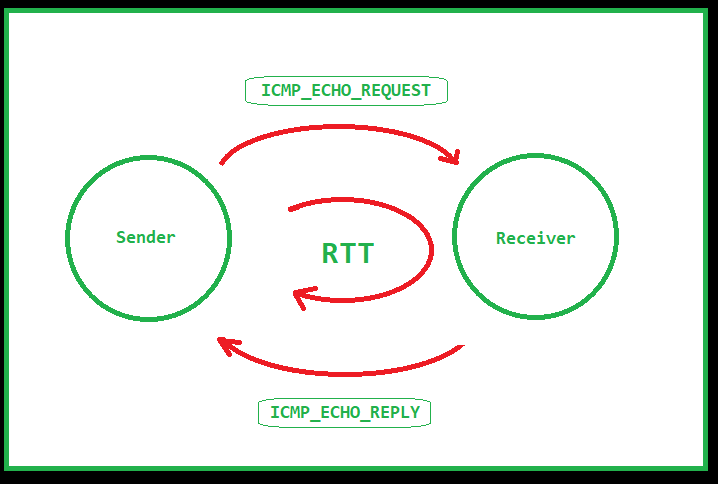
Ping is quite possibly one of the most well known tools available. Simply put, ping sends an “are you there?” message to a remote host. If the host is, in fact, there, it returns a “yup, I’m here” message. It does this using a protocol known as ICMP, or Internet Control Message Protocol. ICMP was designed to be an error reporting protocol and has a wide variety of uses that we won’t go into here.
Ping uses two message types of ICMP, type 8 or Echo Request and type 0 or Echo Reply. When you issue a ping command, the source sends an ICMP Echo Request to the destination. If the destination is available, and allowed to respond, then it replies with an ICMP Echo Reply. Once the message returns to the source, the ping command displays a success message as well as the RTT or Round Trip Time. RTT can be an indicator of the latency between the source and destination.
Note: ICMP is typically a low priority protocol meaning that the RTT is not guaranteed to match what the RTT is to a higher priority protocol such as TCP.
When the ping command completes, it displays a summary of the ping session. This summary tells you how many packets were sent and received, how much packet loss there was, and statistics on the RTT of the traffic. Ping is an excellent first step to identifying whether or not a destination is “alive” or not. Keep in mind, however, that some networks block ICMP traffic, so a failure to respond is not a guarantee that the destination is offline.
 $ ping google.com
PING google.com (172.217.10.46): 56 data bytes
64 bytes from 172.217.10.46: icmp_seq=0 ttl=56 time=15.740 ms
64 bytes from 172.217.10.46: icmp_seq=1 ttl=56 time=14.648 ms
64 bytes from 172.217.10.46: icmp_seq=2 ttl=56 time=11.153 ms
64 bytes from 172.217.10.46: icmp_seq=3 ttl=56 time=12.577 ms
64 bytes from 172.217.10.46: icmp_seq=4 ttl=56 time=22.400 ms
64 bytes from 172.217.10.46: icmp_seq=5 ttl=56 time=12.620 ms
^C
--- google.com ping statistics ---
6 packets transmitted, 6 packets received, 0.0% packet loss
round-trip min/avg/max/stddev = 11.153/14.856/22.400/3.689 ms
The example above shows a ping session to google.com. From the output you can see the IP address being contacted, the sequence number of each packet sent, and the round trip time. 6 packets were sent with an average RTT of 14ms.
One thing to note about the output above and the ping utility in general. Ping is strictly an IPv4 tool. If you’re testing in an IPv6 network you’ll need to use the ping6 utility. The ping6 utility works roughly identical to the ping utility with the exception that it uses IPv6.
Traceroute
Traceroute is a finicky beast. The premise is that you can use this tool to identify the path between a source and destination point. That’s mostly true, with a couple of caveats. Let’s start by explaining how traceroute works.
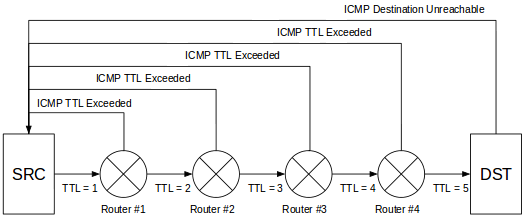
Think of traceroute as a string of ping commands. At each step along the path, traceroute identifies the IP of the hop as well as the latency to that hop. But how is it finding each hop? Turns out, it’s using a bit of trickery.
Traceroute uses UDP or ICMP, depending on the OS. On a typical *nix system it uses UDP by default, sending traffic to port 33434 by default. On a Windows system it uses ICMP. As with ping, traceroute can be blocked by not responding to the protocol/port being used.
When you invoke traceroute you identify the destination you’re trying to reach. The command begins by sending a packet to the destination, but it sets the TTL of the packet to 1. This is significant because the TTL value determines how many hops a packet is allowed to pass through before an ICMP Time Exceeded message is returned to the source. The trick here is to start the TTL at 1 and increment it by 1 after the ICMP message is received.
$ traceroute google.com
traceroute to google.com (172.217.10.46), 64 hops max, 52 byte packets
 1  192.168.1.1 (192.168.1.1)  1747.782 ms  1.812 ms  4.232 ms
 2  10.170.2.1 (10.170.2.1)  10.838 ms  12.883 ms  8.510 ms
 3  xx.xx.xx.xx (xx.xx.xx.xx)  10.588 ms  10.141 ms  10.652 ms
 4  xx.xx.xx.xx (xx.xx.xx.xx)  14.965 ms  16.702 ms  18.275 ms
 5  xx.xx.xx.xx (xx.xx.xx.xx)  15.092 ms  16.910 ms  17.127 ms
 6  108.170.248.97 (108.170.248.97)  13.711 ms  14.363 ms  11.698 ms
 7  216.239.62.171 (216.239.62.171)  12.802 ms
    216.239.62.169 (216.239.62.169)  12.647 ms  12.963 ms
 8  lga34s13-in-f14.1e100.net (172.217.10.46)  11.901 ms  13.666 ms  11.813 ms
Traceroute displays the source address of the ICMP message as the name of the hop and moves on to the next hop. When the source address matches the destination address, traceroute has reached the destination and the output represents the route from the source to the destination with the RTT to each hop. As with ping, the RTT values shown are not necessarily representative of the real RTT to a service such as HTTP or SSH. Traceroute, like ping, is considered to be lower priority so RTT values aren’t guaranteed.
There is a second caveat with traceroute you should be aware of. Traceroute shows you the path from the source to the destination. This does not mean that the reverse is true. In fact, there is no current way to identify the path from the destination to the source without running a second traceroute from the destination. Keep this in mind when troubleshooting path issues.
Netstat
Netstat is an indispensable tool that shows you all of the network connections on an endpoint. That is, by invoking netstat on your local machine, all of the open ports and connections are shown. This includes connections that are not completely established as well as connections that are being torn down.
$ sudo netstat -anptu
Active Internet connections (servers and established)
Proto Recv-Q Send-Q Local Address           Foreign Address         State       PID/Program name
tcp        0      0 0.0.0.0:25              0.0.0.0:*               LISTEN      4417/master
tcp        0      0 0.0.0.0:443             0.0.0.0:*               LISTEN      2625/java
tcp        0      0 192.168.1.38:389        0.0.0.0:*               LISTEN      559/slapd
tcp        0      0 0.0.0.0:22              0.0.0.0:*               LISTEN      1180/sshd
tcp        0      0 192.168.1.38:37190      192.168.1.38:389        ESTABLISHED 2625/java
tcp        0      0 192.168.1.38:389        192.168.1.38:45490      ESTABLISHED 559/slapd
The output above shows several different ports in a listening state as well as a few established connections. For listening ports, if the source address is 0.0.0.0, it is listening on all available interfaces. If there is an IP address instead, then the port is open only on that specific interface.
The established connections show the source and destination IPs as well as the source and destination ports. The Recv-Q and Send-Q fields show the number of bytes pending acknowledgement in either direction. Finally, the PID/Program name field shows the process ID and the name of the process responsible for the listening port or connection.
Netstat also has a number of switches that can be used to view other information such as the routing table or interface statistics. Both IPv4 and IPv6 are supported. There are switches to limit to either version, but both are displayed by default.
In recent years, netstat has been superseded by the ss command. You can find more information on the ss command in this post by Ken Hess.
Conclusion
As you can see, these tools are invaluable when troubleshooting network issues. As a network or systems administrator, I highly recommend becoming intimately familiar with these tools. Having these available may save you a lot of time troubleshooting.
This post first appeared on Redhat’s Enable Sysadmin community. You can find the post here.
Simple Network Management Protocol, or SNMP, has been around since 1988. While initially intended as an interim protocol as the Internet was first being rolled out, it quickly became a de facto standard for monitoring — and in some cases, managing — network equipment. Today, SNMP is used across most networks, small and large, to monitor the very equipment you likely passed through to get to this blog entry.
There are three primary flavors of SNMP: SNMPv1, SNMPv2c, and SNMPv3. SNMPv1 is, by far, the more popular flavor, despite being considered obsolete due to a complete lack of discernible security. This is likely because of the simplicity of SNMPv1 and that it’s generally used inside of the network and not exposed to the outside world.
The problem, however, is that SNMPv1 and SNMPv2c are unencrypted and even the community string used to “authenticate” is sent in the clear. An attacker can simply listen on the wire and grab the community as it passes by. This gives the attacker access to valuable information on your various devices, and even the ability to make changes if write access is enabled.
But wait, you may be thinking, what about SNMPv3? And you’re right, SNMPv3 *can* be more secure by using authentication and encryption. However, not all devices support SNMPv3 and thus interoperability becomes an issue. At some point, you’ll have to drop down to SNMPv2c or SNMPv1 and you’re back to the “in the clear” issue.
Despite the security shortcoming, SNMP can still be used without compromising the security of your server or network. Much of this security will rely on limiting use of SNMP to read-only and using tools such as iptables to limit where incoming SNMP requests can source from.
To keep things simple, we’ll worry about SNMPv1 and SNMPv2c in this article. SNMPv3 requires some additional setup and, in my opinion, isn’t worth the hassle. So let’s get started with setting up SNMP.
First things first, install the net-snmp package. This can be installed via whatever package manager you use. On the Redhat based systems I use, that tool is yum.
$ yum install net-snmp
Next, we need to configure the snmp daemon, snmpd. The configuration file is located in /etc/snmp/snmpd.conf. Open this file in your favorite editor (vim FTW!) and modify it accordingly. For example, the following configuration enables SNMP, sets up a few specific MIBs, and enables drive monitoring.
################################################################################
# AGENT BEHAVIOUR

agentaddress udp:0.0.0.0:161

################################################################################
# ACCESS CONTROL

# ------------------------------------------------------------------------------
# Traditional Access Control

# ------------------------------------------------------------------------------
# VACM Configuration
#       sec.name       source        community
com2sec notConfigUser default mysecretcommunity


#       groupName      securityModel securityName
group   notConfigGroup v1            notConfigUser
group   notConfigGroup v2c           notConfigUser

#       name          incl/excl  subtree             mask(optional)
view    systemview included .1.3.6.1.2.1.1
view    systemview included .1.3.6.1.2.1.2.2
view    systemview included .1.3.6.1.2.1.25
view    systemview included .1.3.6.1.4.1.2021
view    systemview included .1.3.6.1.4.1.8072.1.3.2.4.1.2

#       group          context sec.model sec.level prefix read       write notif
access  notConfigGroup ""      any       noauth    exact  systemview none  none

# ------------------------------------------------------------------------------
# Typed-View Configuration

################################################################################
# SYSTEM INFORMATION

# ------------------------------------------------------------------------------
# System Group
sysLocation The Internet
sysContact Internet Janitor
sysServices 72
sysName myserver.example.com

################################################################################
# EXTENDING AGENT FUNCTIONALITY


###############################################################################
## Logging
##

## We do not want annoying "Connection from UDP: " messages in syslog.
## If the following option is set to 'no', snmpd will print each incoming
## connection, which can be useful for debugging.

dontLogTCPWrappersConnects no

################################################################################
# OTHER CONFIGURATION

disk /         10%
disk /var      10%
disk /tmp      10%
disk /home     10%
Next, before you start up snmpd, make sure you configure iptables to allow SNMP traffic from trusted sources. SNMP uses UDP port 161, so all you need is a simple rule to allow traffic to pass. Be sure to add an outbound rule as well; UDP traffic is stateless.
You can set this up in firewalld as well, just search for SNMP and firewalld on Google.
Now that SNMP is set up, you can point an SNMP client at your server and pull data. You can pull data via the name of the MIB (if you have the MIB definitions installed) or via the OID.
And that’s about it. It’s called SIMPLE Network Management Protocol for a reason, after all.
One additional side note about SNMP. While SNMP is pretty solid, the security shortcomings are significant. I recommend looking at other solutions such as agent-based systems versus using SNMP. Tools like Nagios and Prometheus have more secure mechanisms for monitoring systems.
For the past 30 or so years, if you wanted to proxy traffic to your web server, there were two, sometimes three, primary applications you reached for. Apache httpd, nginx, and HAProxy.
Apache httpd is one of the first web servers created, and is currently one of the most popular in use. While primarily used to serve web traffic, httpd can also be used to proxy traffic with the mod_proxy module. In addition to acting as a simple proxy, mod_proxy can also cache traffic, allowing for significant latency reduction for clients.
HAProxy is another option for proxying traffic. HAProxy tends to be deployed in load balancing scenarios and not single-server proxy situations. It is used by a number of high profile websites due to its speed and efficiency.
Finally, nginx is the third proxying solution. In addition to proxying, nginx can also serve many of the same roles as Apache httpd including local balancing, caching, and traditional web serving. Like haproxy, nginx is known for more efficient memory usage as compared to Apache httpd.
These solutions are battle hardened and have worked well for many years. But as technology changes, it often requires changes in the tools we use. With the advent of containerization, the tools we use should be re-examined and we should determine if we still have the best tools for the job.
Both nginx and haproxy were the primary choices used for proxying with containers. As the technology matured, however, new tools were created to take advantage of new features. One of those tools is Traefik.
Traefik is, according to their marketing, a “cloud native edge router.” If we tear apart the marketing speak, it’s basically a proxy built with containers in mind. It’s written in Go, and it has quite a few tricks up its sleeve.
You can use Traefik in the same general context as any of the other proxies, deploying it on a normal server and using a static configuration. Even deployed like this, the configuration is quite straightforward and very flexible.
But the real power of Traefik comes when it’s deployed in a container environment. Instead of using a static configuration, Traefik can listen to the docker daemon for specific labels applied to containers. Those labels contain the Traefik configuration for the container they’re applied to. It works similar to the static configuration, but it’s dynamic in nature, configuring Traefik as containers are started and stopped.
The community version of Traefik allows this by directly mounting the docker socket file, which is a bit of a security risk. If this container were to be compromised, an attacker could use the mounted socket to control other containers on the server. So this isn’t a secure way of deploying Traefik.
There are other ways to deploy, however, that make the system inherently more secure. Traefik has released an enterprise version, TraefikEE, that decouples the configuration management piece into its own container. This container also mounts the docker socket file, but has no external ports open, thereby isolating the container. The purpose of this new management container is to read changes in the labels and push the configuration to the primary Traefik container. It also scales, allowing additional Traefik nodes to be added which will receive the configuration from the management container.
Another way to deploy this securely is to use an external storage container for the traefik configuration. Consul is a popular option for this. Consul, amongst other things, is a key-value store. The configuration for Traefik can be stored here and dynamically updated as needed. Traefik will automatically re-read the configuration and adjust accordingly.
There are caveats with this method, however. First, you’ll need a way to get the configuration for the containers into Consul. Fortunately, there’s an open source project that may be able to do this already called registrator.
The registrator project works similar to how the management container works for TraefikEE, though in a more general way. It’s not specifically for Traefik, but intended to register containers with Consul. It’s an isolated container that listens for labels and adds the data to Consul. There are no open ports, reducing the likelihood that this particular container can be compromised and used to attack the rest of the system.
I haven’t tested using registrator in this way, however. (It doesn’t work, see the UPDATE below) I believe it would require modifying the registrator configuration to both register the containers as well as add arbitrary configuration information to Consul. This is something I’ll be investigating later as I learn more about how Consul works.
Another caveat to this approach is that there is no atomic update mechanism in Consul. What this means is that if Consul reads the configuration while it’s being updated by something like registrator, it’s will end up using an incomplete configuration until the next time it reads the configuration. There is a workaround for this in the documentation, but it requires additional programming to put into place.
Despite these few drawbacks, however, Traefik is an amazing tool for proxying in a container environment. And the Containous team is hard at work on version 2 which significantly cleans up and enhances the configuration possible with Traefik as well as adding the ability to add middleware functions that can be used to dynamically alter traffic as it passes through Traefik. Definitely worth checking out when it’s released.
UPDATE: I finally had a chance to do some research on registering services with Consul and inserting data in the to he KV store. Unfortunately, registrator can’t do this job. It only handles creating tags on a Consul entry and not KV entries.
I have been unsuccessful, thus far, in finding a solution for this particular use case. However, I believe that the registrator source code can be updated to allow for this.
SPOFs, or a Single Points of Failure, are the points in a system that can cause a complete failure of the overall system. These can be both technological and operational in nature. Creating a truly resilient system means identifying and mitigating as many of these as you can. Truly resilient systems minimize SPOFs and put mechanisms in place to handle any SPOFs that can’t be immediately dealt with and minimize the consequences of any given failure.
Single Point of Failure
A single point of failure is a part of a system that, if it fails, will stop the entire system from working. SPOFs are undesirable in any system with a goal of high availability or reliability, be it a business practice, software application, or other industrial system.
If we look back at the first post in this series, there are a multitude of SPOFs that need to be handled. Our first deployment is a single server with a single network feed. The following is a list of immediate SPOFs that need to be dealt with:
Single network connection
Single network interface
Single server
Single database
Monolithic application
Single hard drive
Single power supply
All of these SPOFs are technological in nature. We didn’t explore the operational workflows around this deployment, so identifying non-technological is beyond this particular exercise.
In the second post, we discussed mitigation of some of these SPOFs. Primarily, we distributed services to multiple servers, mitigating the single server as a SPOF. However, the failure of any single service results in the failure of the whole.
Mitigating SPOFs comes down to identifying where you depend on a single resource and developing a strategy to mitigate it. In our previous example, we identified the server as a SPOF and mitigated it by using multiple servers. However, since we’re still dealing with single instances of dependent services, mitigating this SPOF doesn’t help us much.
If we duplicated each service and placed each on its own server, we’re in a much better situation. Failure of any single server, while potentially degrading overall service, will not result in the complete failure of the system. So, we need to identify SPOFs while keeping in mind any dependencies between components.
Now that we’ve deployed multiple copies of each service, what other SPOFs still exist? Each server only has a single power supply, there’s only one network interface on each server, and the overall system only has a single network feed. So we can continue mitigating SPOFs by duplicating each component. For instance, we can add multiple network interfaces to each server, deploy additional network connections, and ensure there are multiple power supplies in each server.
There is a point of diminishing returns, however. Given unlimited time and resources, every SPOF can be eliminated, but is that realistic? In a real world scenario, there are often constraints that cannot be easily overcome. For instance, it may not be possible to deploy multiple network connections in a given location. However, it may be possible to distribute services across multiple locations, thereby eliminating multiple SPOFs in one fell swoop.
By deploying to two or more locations, you potentially eliminate multiple SPOFs. Each location will have a network connection, separate power, and separate facilities. Mitigating each of these SPOFs increases the resiliency of the overall system.
In other situations, there may be financial constraints. Deploying to multiple locations may be cost prohibitive, so mitigations need to come in different forms. Adding additional network interfaces and connections help mitigate network failures. Multiple power supplies mitigate hardware failures. And deploying UPS power or, if possible, separate power sources, mitigates power problems.
Each deployment has its own challenges for resiliency and engineers need to work to identify and mitigate each one.
In the previous article, we discussed a very simple monolithic deployment. One server with all of the relevant services necessary to make our application work. We discussed details such as drive layout, package installation, and some basic security controls.
In this article, we’ll expand that design a bit by deploying individual services and explain, along the way, why we do this. This won’t solve the single point of failure issues that we discussed previously, but these changes will move us further down the path of a reliable and resilient deployment.
Let’s do a quick recap first. Our single server deployment includes a simple website application and a database. We can break this up into two, possibly three distinct applications to be deployed. The database is straightforward. Then we have the website itself which we can break into a proxy server for security and the primary web server where the application will exist.
Why a proxy server, you may ask. Well, our ultimate goals are security, reliability, and resiliency. Adding an additional service may sound counter-intuitive, but with a proxy server in front of everything we gain some additional security as well as a means to load balance when we eventually scale out the application for resiliency and reliability purposes.
The security comes by adding an additional layer between the client and the protected data. If the proxy server is compromised, the attacker still has to move through additional layers to get to the data. Additionally, proxy servers rarely contain any sensitive data on them. ie, there are no usernames or passwords located on the proxy server.
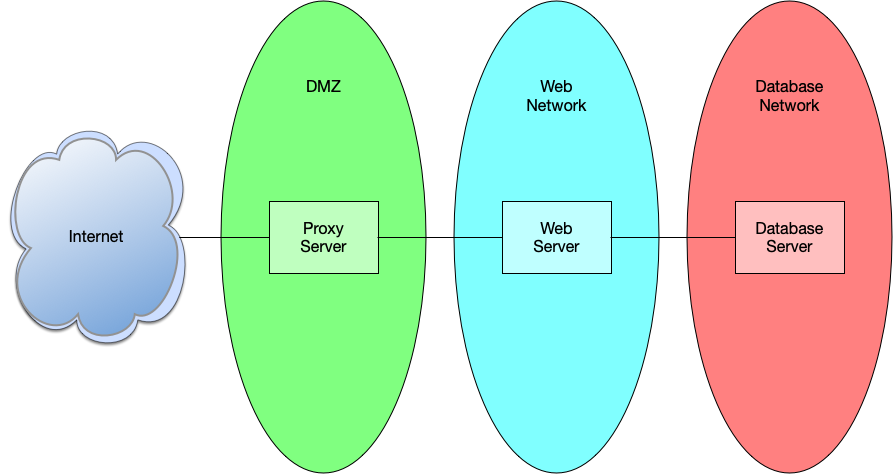
In addition to breaking this deployment into three services, we also want to isolate those services into purpose-built networks. The proxy server should live in what is commonly called a DMZ network, we can place the web server in a network designated for web servers, and the database goes into a database network.
Segmented networks
Keeping these services separate allows you to add additional layers of protection such as firewall rules that limit access to each asset. For instance, the proxy server typically needs ports 80 and 443 open to allow http and https traffic. The web server requires whatever port the web application is running on to be open, and the database server only needs the database port open. Additionally, you can limit the source of the traffic as well. Proxy servers are typically open to the world, but the web server only needs to be open to the proxy server, and the database server only needs to be open to the web server.
With this new deployment strategy, we’ve increased the number of servers and added the need for a lot of new configuration which increases complexity a bit. However, this provides us with a number of benefits. For starters, we have more control over the security of each system, allowing us to reduce the attack surface of each individual server. We’ve also added the ability to place firewalls in between each server, limiting the traffic to specific ports and, in certain instances, from specific hosts.
Separating the services to their own servers also has the potential of allowing for horizontal scaling. For instance, you can run multiple proxy and web servers, allowing additional resiliency in case of the failure of one or more servers. Scaling the proxy servers requires some additional network wizardry or the presence of a load balancing device of some sort, but the capability is there. We’ll discuss horizontal scaling in a future post.
The downside of a deployment like this is the complexity and the additional overhead required. Instead of a single server to maintain, you now have three. You’ve also added firewalls to the mix which also need maintenance. There’s also additional latency added due to the network overhead of communication between the servers. This can be reduced through a number of techniques such as caching, but is generally not an issue for typical web applications.
The example we’ve used, thus far, is quite simplistic and this is not necessarily a good strategy for a small web application deployment, but provides an easy to understand example as we expand our deployment options. In future posts we’ll look at horizontal scaling, load balancing, and we’ll start digging into new technologies such as containerization.


